ETH-USD Looks to Resume Downward Move After Friday’s Bounce

A daily close below minor resistance at $10.7105 today should see ETH-USD extend further to the downside over the long-term. This is also supported by volume indicators showing increased selling interest today across major exchanges. The short-term outlook also looks bearish with a resistance zone around $11.00 which could provide a good shorting opportunity. A break below $10.09876 will give strong confirmation that ETH-USD will continue to head downwards.
ETH-USD failed to sustain Friday’s bullish momentum when the virtual currency gained almost 14 percent against the U.S. Dollar and closed above $11.00 on the Kraken exchange. ETH-USD remains relatively volatile while Bitcoin has hardly moved from it’s $647.78 close on Saturday. Since the weekend, downward momentum has dominated ETH-USD, which is currently down 4.72 percent on today’s open at $10.47. After establishing a daily close below the Ichimoku cloud at $10.54 on the daily timeframe (shown below), the market has only been able to reach as low as $9.75 since then.
However, today’s close looks to be below the conversion (blue) which has acted as resistance and rejected the recent upward advance. Therefore, a bearish outlook will remain over the long term, given that the market closes below the conversion line of $10.7105 today. Also, the lagging (purple) line has now pierced below the cloud, confirming a long-term downward trend is beginning and supporting the signal given on July 5th when the market closed below the Ichimoku cloud.
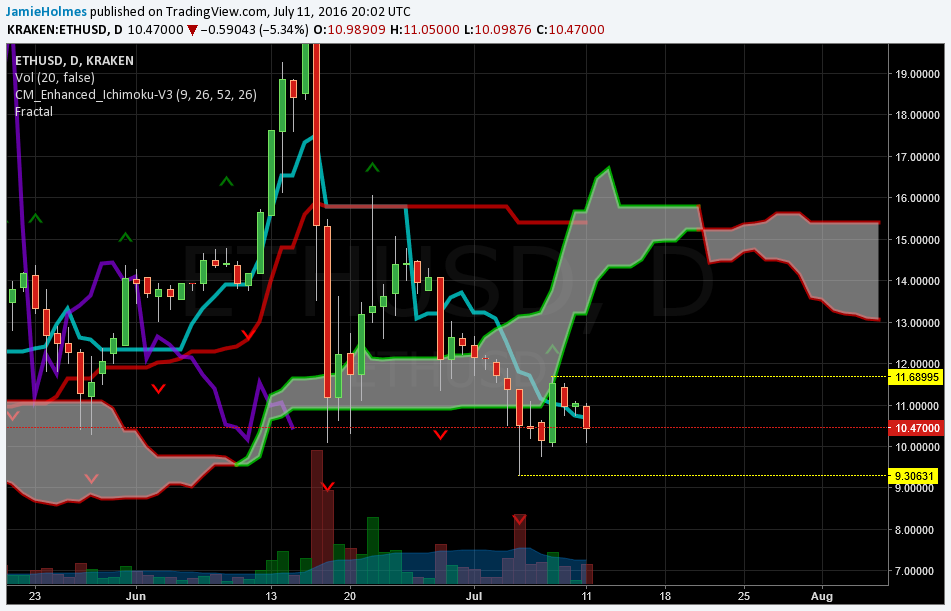
Stronger confirmation of a sell-off will be given when the price action breaks below the most recent fractal buy level, providing support at $9.30631. The market will look to establish fresh lows. Further fractal supports stand at $8.978 and $7.2186.
A bullish outlook is only validated on the daily timeframe is the market manages to close above the conversion line, shown above. The Ichimoku cloud and current price action now have a lot of space between them, with the cloud providing resistance around $13.20 to $15.66. This rises to around $15.50 over the next few days. So as downward momentum becomes exhausted, these will be the initial targets for the market. Also, long positions could be entered into just above the fractal resistance at $11.68995 to take advantage of a bullish breakout. Therefore, a break of the most recent fractal sell level should see initial targets around this zone near $16.00.
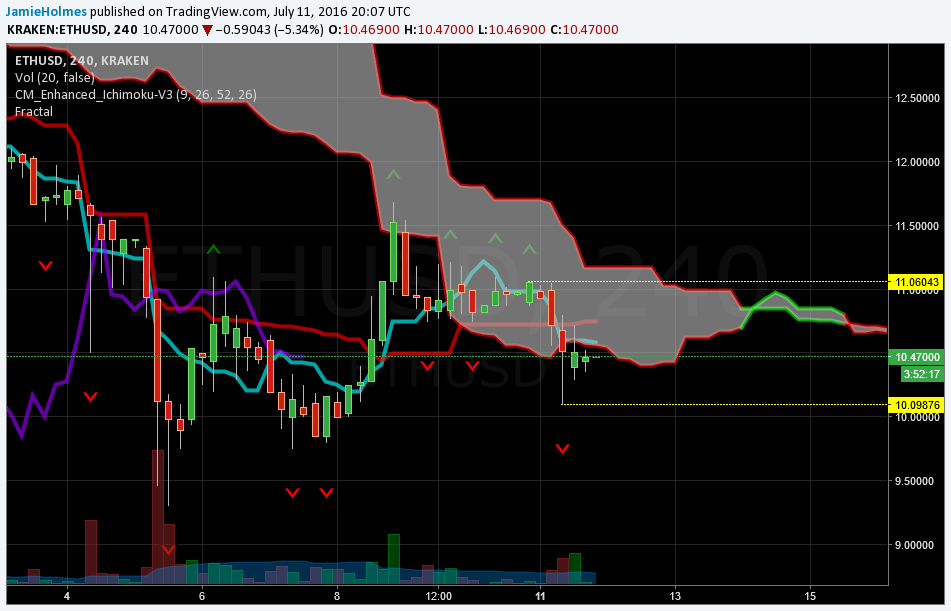
The shorter-term outlook is illustrated below with the 4-hour price action for ETH-USD. The chart illustrates how the cloud previously acted as a resistance zone as buying interest pushed the price above $11.00. This level was rejected and now the market is falling below the Ichimoku cloud again on the 4-hour timeframe, suggesting a higher likelihood of continued downward movement.
The market is currently within two important fractal levels: $11.06043 and $10.09876. These levels provide resistance and support respectively at this timeframe. In short, we should see an upward trend emerge if the market sustains itself above $11.06043. The price will also be above the Ichimoku cloud and will look to target further resistance level at $11.68995 and $12.38500. On the other hand, a break below $10.09876 will expose previous lows around $9.00.
Volumes traded across exchanges have picked up today after low volume sessions yesterday. Volume yesterday on the Kraken exchange was 8,391 net buy contracts compared to 42,339 net sell contracts today suggesting price action will follow in the coming days toward the downside. As the daily chart shows at the beginning of the article, large spikes in net sell volumes (indicated by red bars at the bottom of the chart) are followed by spikes to the downside. Same goes for spikes in net buy volumes (indicated by green bars at the bottom of the charts) which give a sign that the preceding sessions will see ETH-USD appreciate.