Ethereum at critical resistance: will a rejection continue the macro downtrend?

Ethereum faces a decisive moment as it trades into a major resistance zone. After several failed attempts to break higher, price action is showing signs of weakness. The next move will be pivotal in determining whether Ethereum can shift its bearish structure, or continue its macro downtrend.
Ethereum (ETH) is currently testing a key resistance area, and the reaction here could set the tone for the next major move. Despite the recent rally, multiple technical factors suggest that Ethereum remains vulnerable to further downside if this resistance holds. Below, we break down the key confluences at play, critical support to watch, and the conditions needed to flip the market structure bullish.
Key technical points
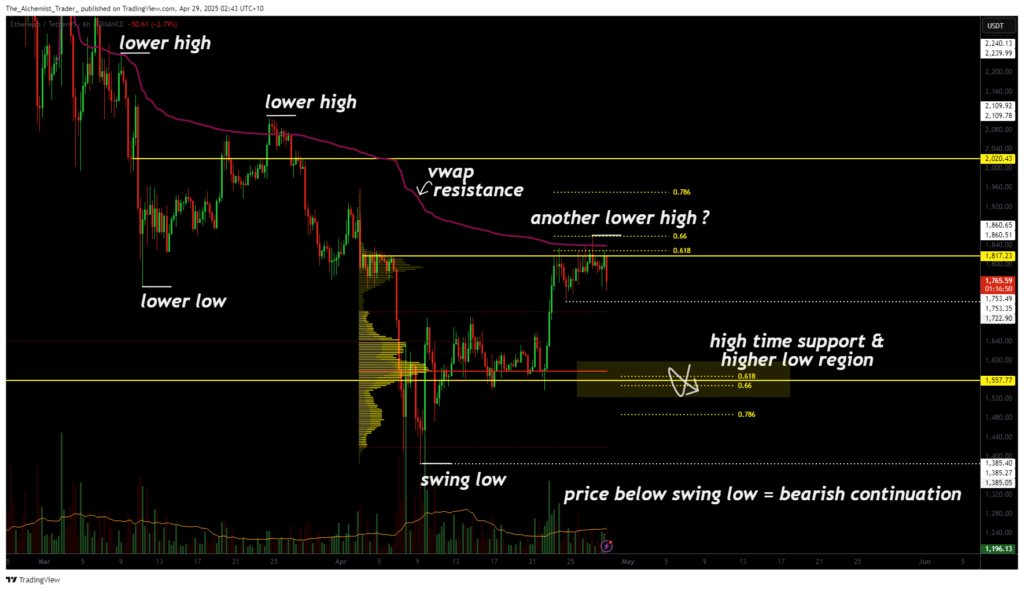
- Ethereum is testing resistance at the 0.618 Fibonacci, VWAP SR, and major daily SR level.
- Key support lies around $1,055, a critical high-timeframe level that must hold for bullish structure to form.
- A failure to hold support risks a break of the swing low, confirming continuation of the bearish daily structure.

Detailed technical discussion
Ethereum’s current trade location sits at a confluence of major resistances: the 0.618 Fibonacci retracement, VWAP supply resistance, and a significant daily horizontal level. Multiple recent daily candles have failed to close above this zone, underscoring persistent weakness despite the rally over the past week.
The key support to monitor lies around $1,055, aligning with a high-timeframe weekly support level. If Ethereum were to retest this area and hold, it could form a higher low , an early sign of strength. However, a failure to hold $1,055 would open the door to breaking the previous swing low, confirming a new lower low and extending the macro downtrend on the daily timeframe.
From a broader perspective, Ethereum’s trade location is extremely critical. A rejection here increases the probability of downside continuation, reinforcing the ongoing pattern of lower highs and lower lows.
Only a strong support reaction at $1,055, backed by increasing volume and a decisive breakout above the current lower high, could flip the structure bullish and suggest a major trend shift.
What to expect in the coming price action
If Ethereum fails to break above the current resistance zone, we can expect another lower high to be confirmed, likely leading to a retest of the $1,055 region. A failure at this support could trigger a deeper sell-off, making new lows and continuing the bearish structure.
However, if Ethereum finds strong support at $1,055, followed by a volume-backed rally and a breakout over resistance, the market could flip bullish, potentially leading to a new higher high and a structural shift to the upside.


