Ethereum ETFs reclaim inflow streak as ETH price holds $4,500


Ethereum-tracking ETFs are back in the green, drawing fresh inflows as investor attention returns amid the asset’s steady performance.
- Ethereum ETFs recorded about $360 million in inflows on Sept. 16, led by BlackRock’s ETHA.
- U.S.-listed ETH funds have now posted five straight days of inflows, totaling $1.1 billion.
- Bitcoin ETFs remain ahead with nearly $2.6 billion in inflows over a six-day streak.
- Ethereum price is consolidating near $4,500, up 3.4% on the week and 8% from this month’s low.
Ethereum ETFs recorded about $360 million in inflows on September 15, according to SoSoValue data. This was their second-strongest daily figure since turning positive earlier this month, extending their recovery streak.
BlackRock’s ETHA accounted for the bulk of inflows with $363 million, followed by Grayscale’s ETHE with $10 million. In contrast, Fidelity saw $13.5 million in outflows, offsetting part of the day’s total, while the remaining six issuers recorded no activity.
With the latest activity, U.S.-listed exchange-traded funds have now logged a five-day inflow streak, recovering from the negative performance seen at the start of the month. Over this period, the products have attracted roughly $1.1 billion, though they still trail their Bitcoin (BTC) counterparts, which drew nearly $2.6 billion over a stronger six-day streak.
The rebound highlights renewed institutional interest in Ethereum ETFs after a cooling period earlier this month that coincided with price weakness. With ETH (ETH) itself now displaying signs of strength, investors appear more confident in the asset’s long-term outlook.
Ethereum ETFs strong as price holds key support
ETH’s price is hovering around $4,509 at press time, posting a slight 0.02% decline in the past 24 hours, according to crypto.news data. The second-largest asset is up 3.4% on the week and nearly 8% from its low earlier this month near $4,180.
On the charts, Ethereum remains above its 50-day moving average, now around $4,275, which acts as a key support level. The daily RSI is sitting near 54, pointing to neutral momentum rather than overbought or oversold conditions.
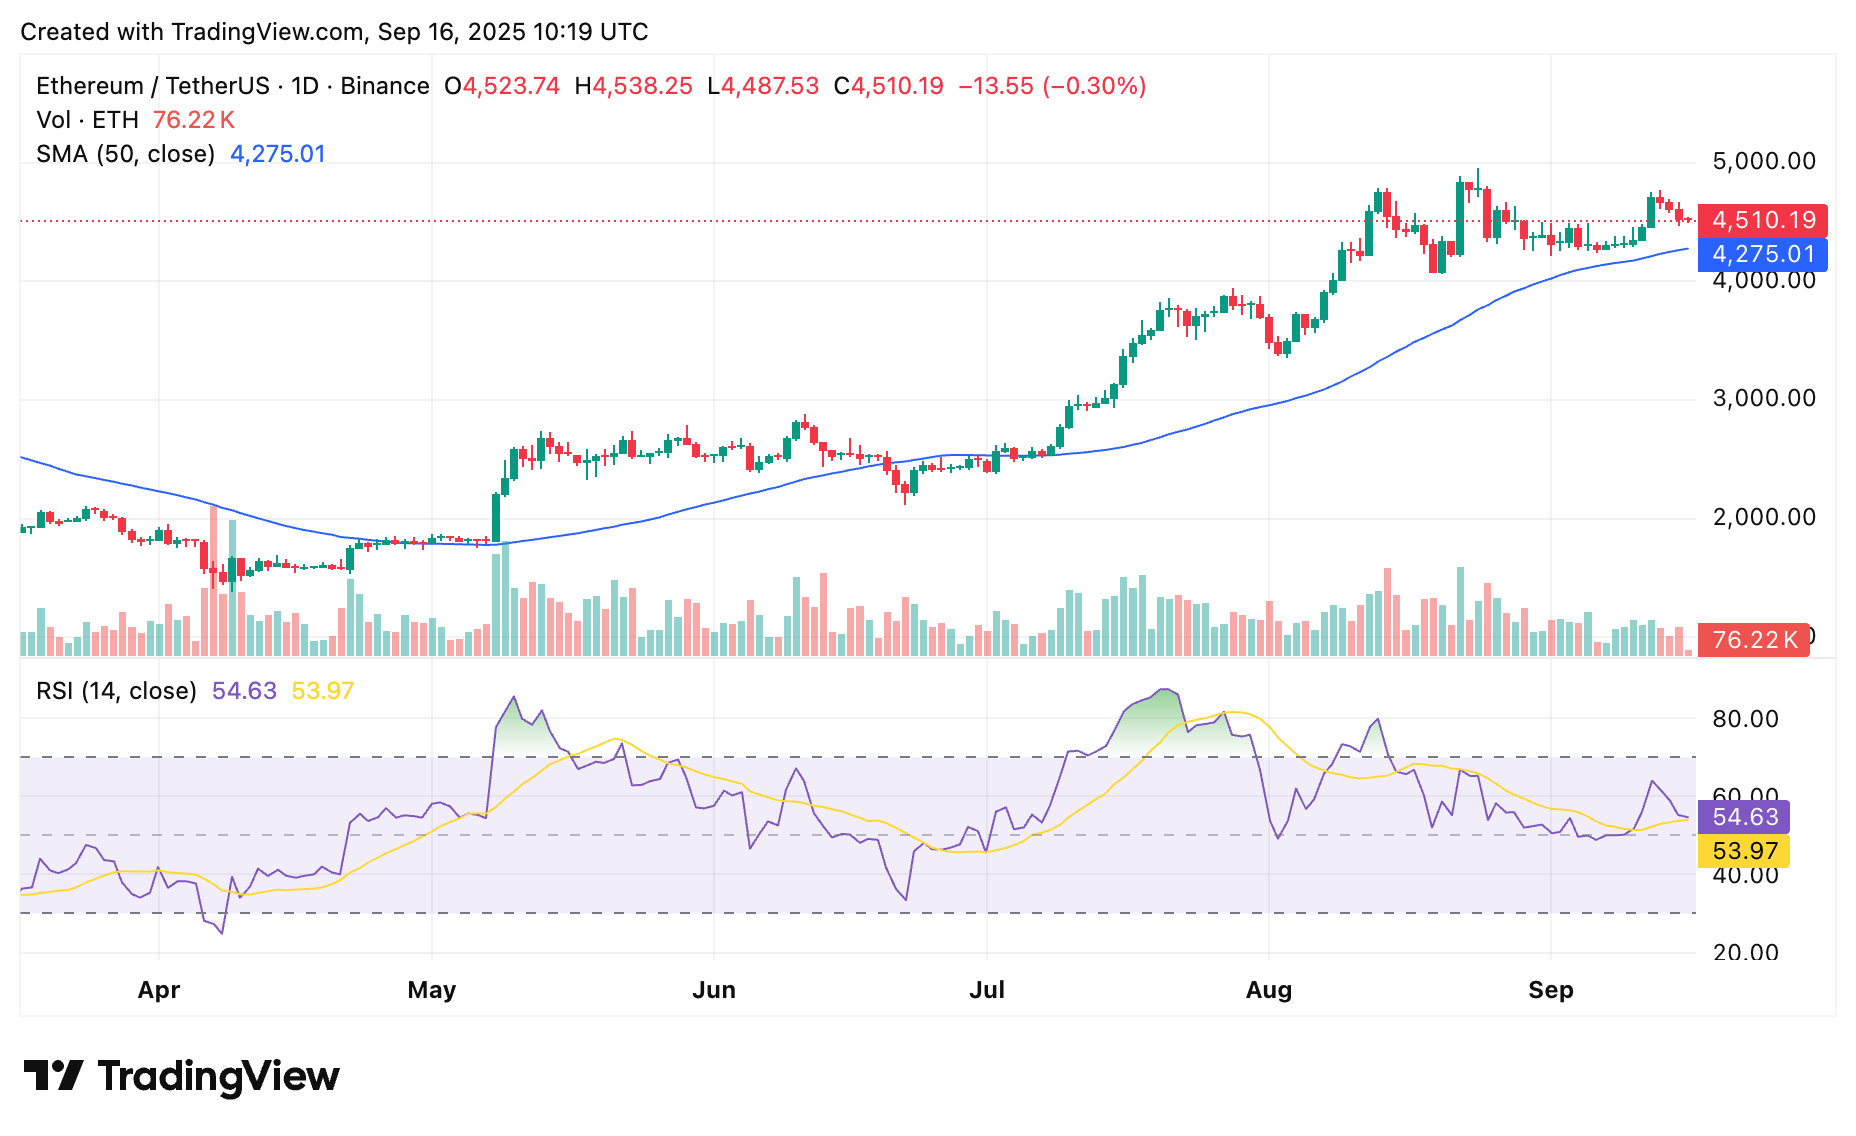
This setup suggests ETH is consolidating after its early September peak close to $5,000. A firm hold above $4,300 would keep the bullish structure intact, with the next test likely coming at $4,800 to $5,000. However, a breakdown below the 50-day average could open the door to further weakness.
If the current momentum holds, Ethereum ETFs could continue to attract strong inflows, potentially boosting performance into the final quarter of the year. Much will depend on ETH holding support above $4,500 and on broader risk appetite in the crypto market.