Ethereum eyes move to $3,000 as bullish technical patterns emerge


Ethereum could rally as high as $3,000 in the coming weeks as bullish technicals have emerged amid retail and institutional demand.
According to data from crypto.news, Ethereum (ETH) jumped 6.5% to an intraday high of $2,644 on June 3 (Asian morning hours), pushing its market cap to over $314.8 billion. It was the top performer among the 10 largest cryptocurrencies today, up nearly 86% from its year-to-date low.
On the derivatives front, open interest in ETH futures has surged to $35.67 billion, nearing its all-time high and well above the $19.6 billion recorded on April 3, per CoinGlass. Further, its long/short ratio on Binance was 1.8 at press time, indicating a clear bullish bias among traders.
Meanwhile, its funding rates have also remained positive for over a month.
ETH’s bullish setup is further reinforced by strong institutional inflows and on-chain trends suggesting reduced selling pressure.
According to CoinShares data, ETH-based investment products attracted $321 million in inflows last week, their highest weekly figure since December 2024. That momentum continued in U.S. markets, with spot Ether ETFs recording four straight weeks of positive inflows totaling over $653.9 million.
At the same time, the ETH supply on centralized exchanges has dropped to its lowest level in over seven years. This steady decline in exchange balances suggests increased self-custody, typically a sign that investors are positioning for long-term gains rather than short-term selling.
Meanwhile, several major corporations have also shown interest in the flagship altcoin, with notable recent purchases from firms such as BTCS and Fidelity, both of which have significantly increased their ETH holdings.
ETH price analysis
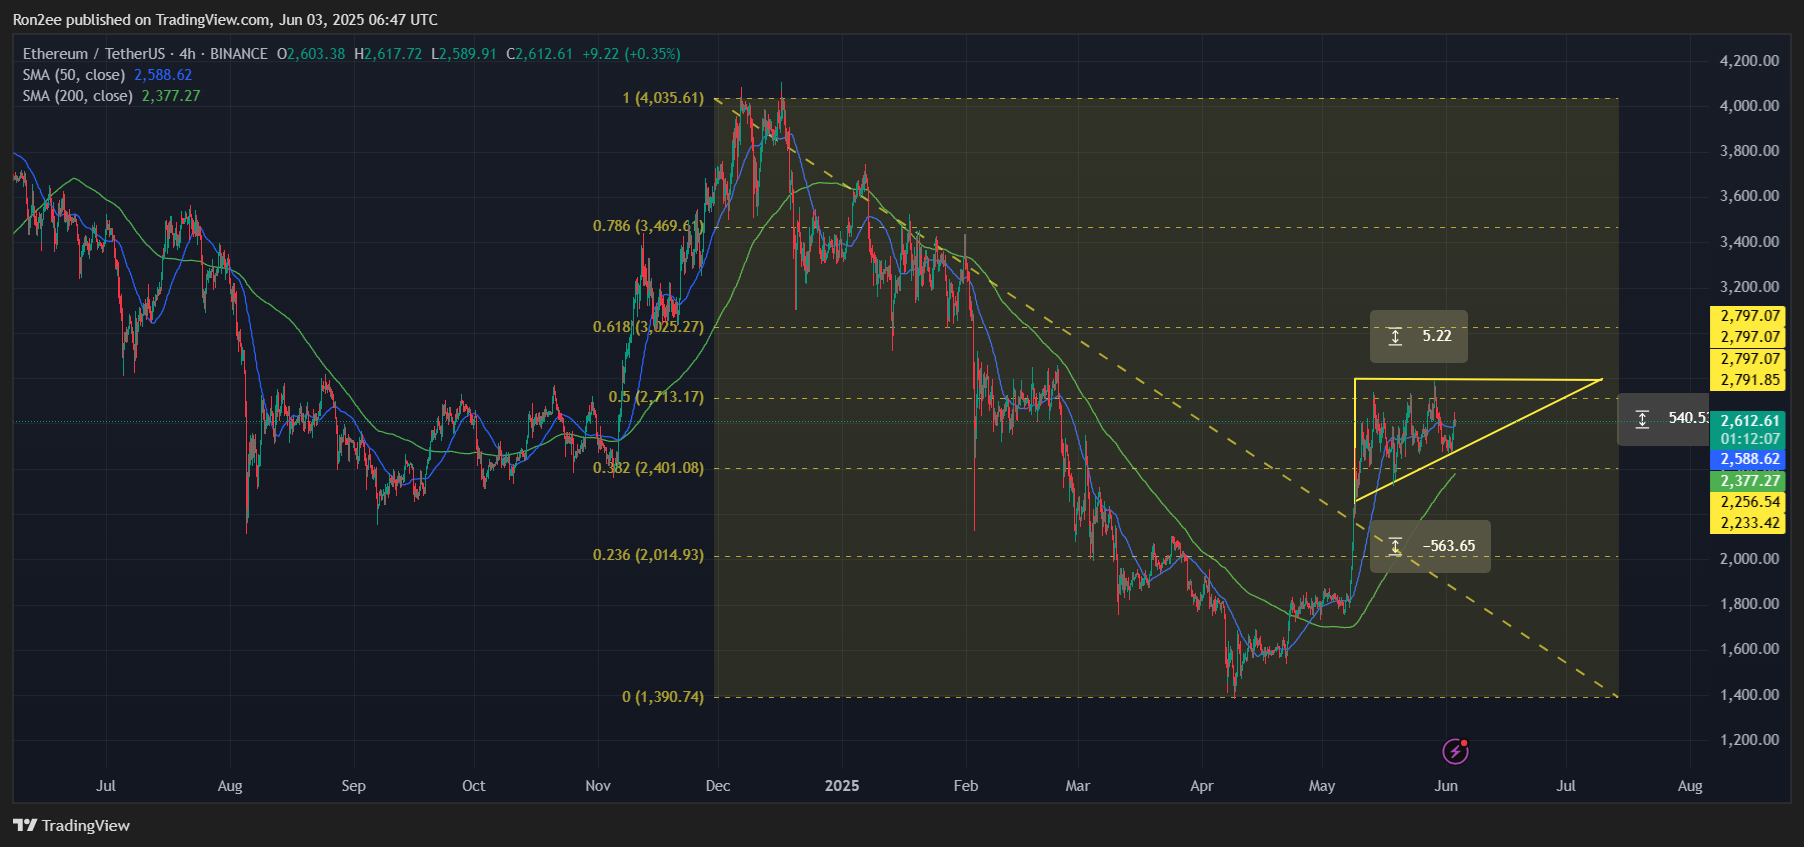
On the 4-hour ETH/USDT chart, ETH price remains above the rising trendline of a multi-week ascending triangle and is holding firm above the 50-period Simple Moving Average, a sign of sustained bullish momentum.
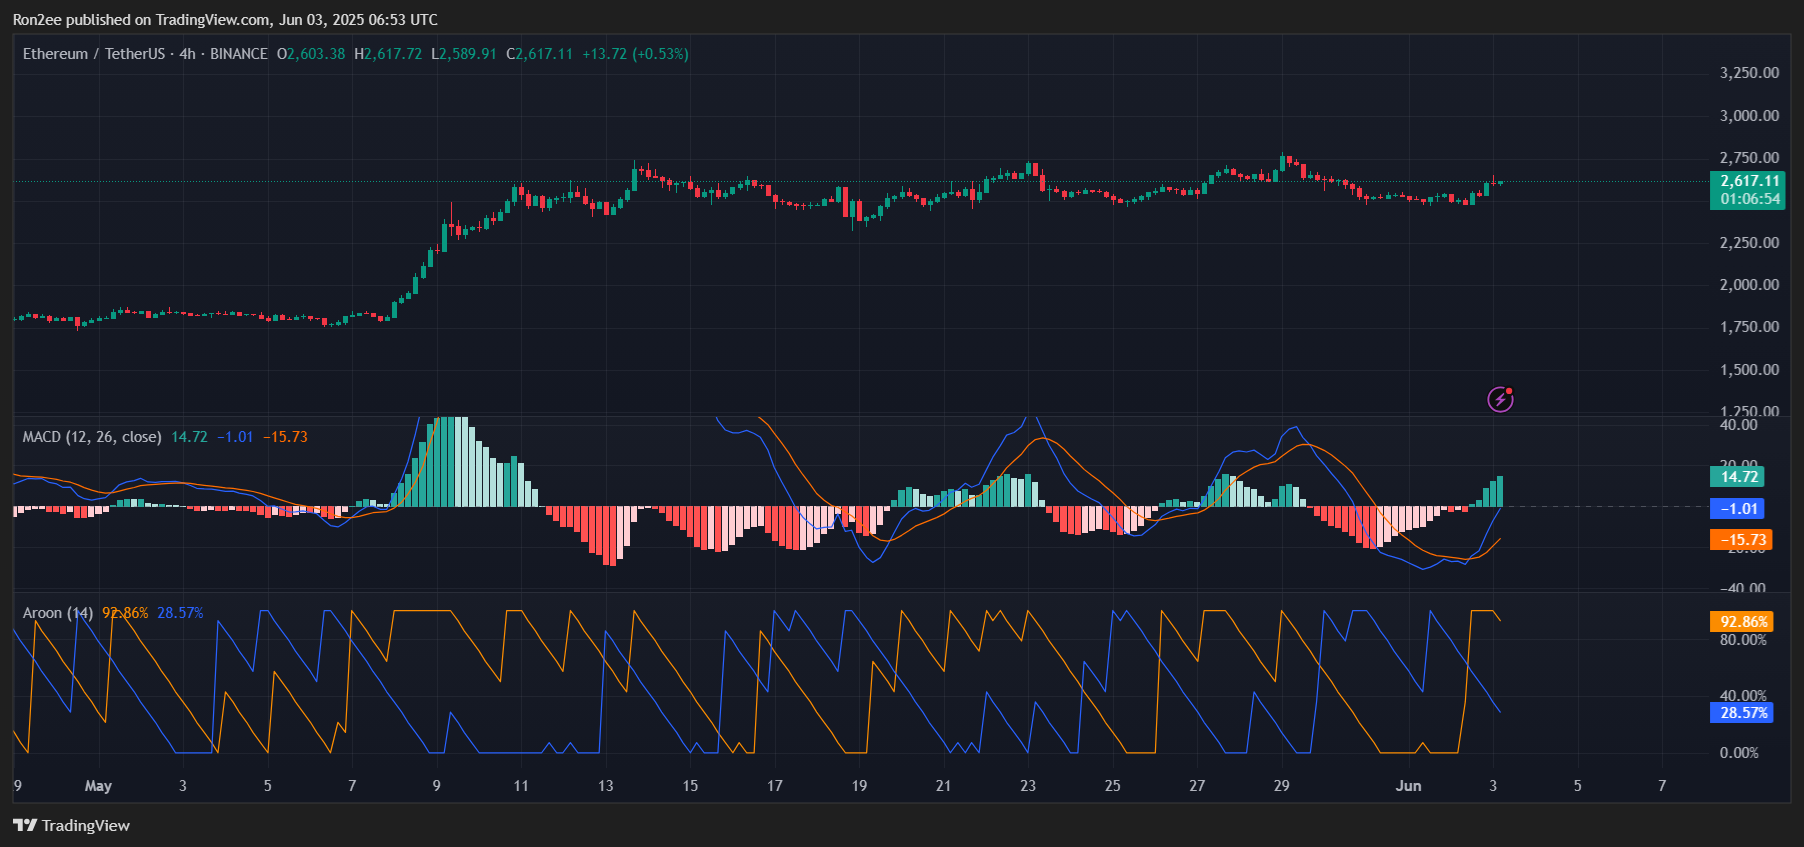
The Aroon Up indicator is currently at 92.87%, while the Aroon Down is at 28.57%, showing that the uptrend is clearly dominating. To top it off, the MACD has made a bullish crossover, further confirming upward pressure.
If this momentum continues, ETH could first test the $2,713 level, which lines up with the 50% Fibonacci retracement zone. A breakout above that could pave the way toward $3,000, Ethereum’s 61.8% retracement level, which would mark a roughly 15% jump from its current price.
On the flip side, if ETH dips below $2,500, it might invalidate the current bullish setup. In that case, we could see a pullback toward the $2,377 level, which coincides with the 200-day SMA and may act as a key support zone.