Ethereum nosedives: 32% weekly drop, largest YTD loss


Ethereum collapses 32% in a week, with an 18% drop in the last 24 hours alone, as the crypto market as a whole records its largest dip this year.
The Ethereum (ETH) price action on the daily chart shows a dramatic decline with the current price at $2,350 down by 12.35% for the day. This drop has pushed Ethereum below the lower Bollinger Band, currently at $2,650, a key index for indicating that the asset may be oversold.
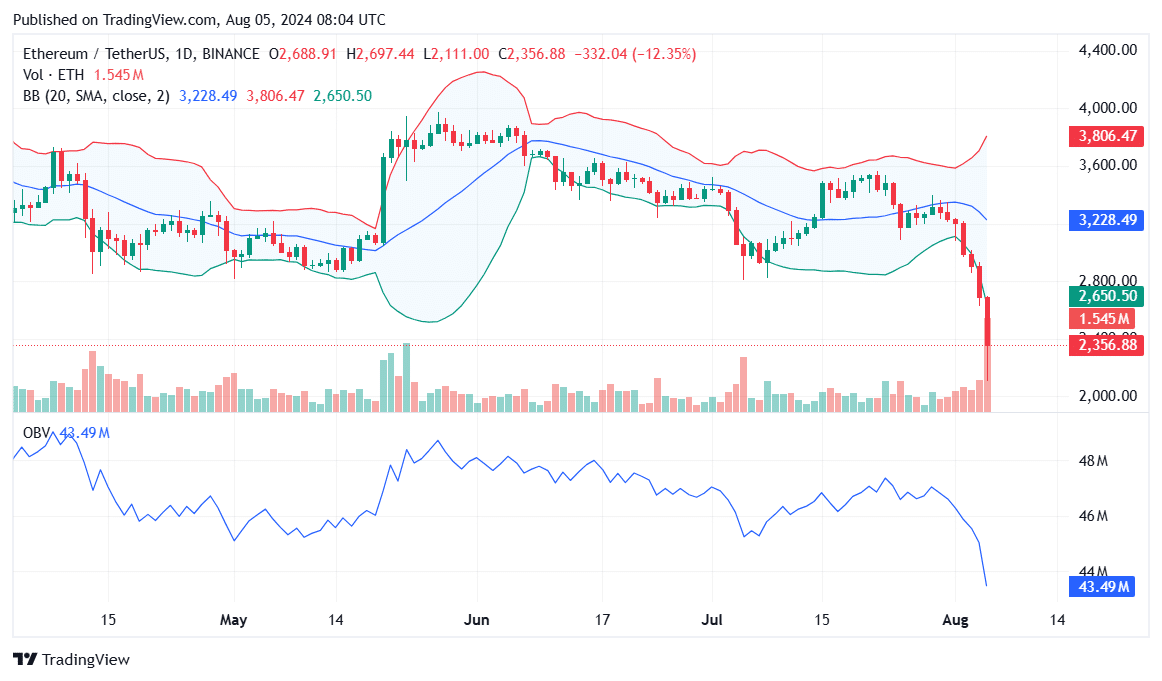
The Bollinger Bands indicate heightened volatility, with the bands expanding significantly. Ethereum’s position below the lower band typically suggests the asset is oversold and might be due for a bounce back, indicating bearish pressure if the price does not recover soon.
ETH’s On-Balance Volume (OBV) confirms this bearish sentiment. The OBV currently stands at 43.49 million, having declined sharply in tandem with the price drop, suggesting that sell pressure is substantion.
As more volume is associated with downward price movements, if ETH’s OBV continues to decrease, this would indicate persistent selling and potential for further declines in Ethereum’s price.
ETH weekly chart at critical condition
The weekly chart shows Ethereum’s situation does not look much better. The price has broken below the lower Donchian Channel, which is at $2,111. Currently, the upper and middle Donchian Channels are at $3,977 and $3,044, respectively.
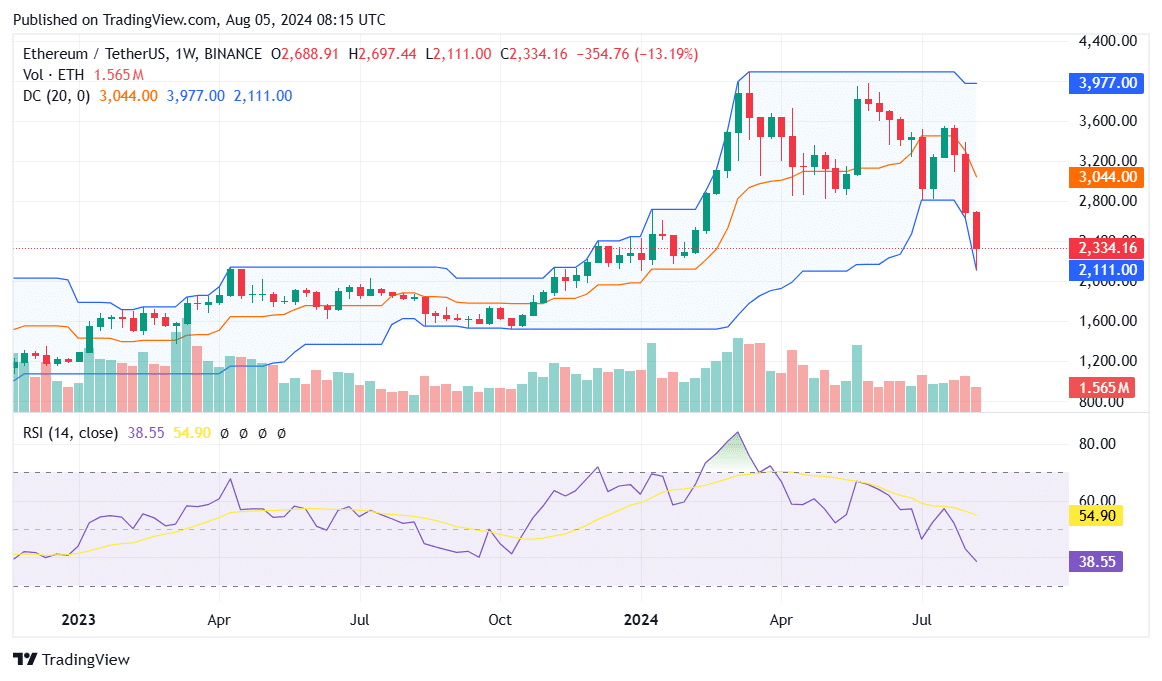
This breach of the lower channel indicates a strong bearish trend, as it shows the price has reached new lows not seen in the past 20 trading periods. A weekly close below this level could signal further downside risk.
Moreover, the Relative Strength Index (RSI) on the weekly chart currently stands at 38.55, down from a recent high of 54.90. If the RSI drops further below 30, it would confirm an oversold condition, potentially leading to a short-term bounce at or above the $2,800 mark.
However, the current trend shows weakening momentum, and unless there is a strong reversal, ETH’s downward pressure could persist.
What next for Ethereum?
Looking ahead, Ethereum’s immediate future largely depends on its ability to reclaim key support levels. On the daily chart, a recovery above the lower Bollinger Band at $2,650 could stabilize the price.
Meanwhile, on the weekly chart, a move back within the Donchian Channels, particularly above the middle band at $3,044, would be a positive sign.
However, if the current bearish momentum continues, we could see Ethereum testing lower support levels around $2,000, with a possibility of further declines if broader market conditions remain unfavorable.
Analyst Benjamin Cowen argued that Ethereum might stabilize around its current levels in the short term before potentially experiencing another leg down, particularly if macroeconomic conditions, such as rate cuts, play out similarly to past market cycles.
Also, market veteran Peter Brandt suggests that Ethereum is close to hitting its floor. With a rectangle pattern ranging from $4,500 to $2,814, the analyst calculates the downside bottom to be around $2,000, suggesting that this target is almost fulfilled.