Ethereum price dips below $3K — does $238M spot ETH ETF outflow signal deeper pullback?


Ethereum price slipped below the psychological $3,000 level as selling pressure increased across spot and derivatives markets.
- Ethereum dropped under $3,000 after $229M in spot ETF outflows ended a five-day inflow streak.
- Derivatives data shows position unwinding, while RSI and Bollinger Bands point to near-term weakness.
- CryptoQuant data shows exchange reserves at multi-year lows, limiting selling pressure longer term.
ETH was trading at $2,978 at press time, down 4.6% over the past 24 hours. The token is still up 1.7% over the last month, but it has dropped 10% over the last 7 days. 24-hour volume increased 58% to $34.3 billion, indicating increased trading activity during the decline.
Ethereum (ETH) derivatives volume rose 65% to $74.9 billion, while open interest decreased 2% to $39.37 billion, according to CoinGlass data. This pattern often appears when traders close positions amid uncertainty instead of taking on new leverage.
ETF outflows weigh on price but exchange supply keeps falling
Spot Ethereum exchange-traded funds saw a sharp reversal in flows. Data from SoSoValue shows that U.S. spot ETH ETFs recorded net outflows of $229.95 million on Jan. 20, snapping a five-day inflow streak.
BlackRock’s ETHA led the exits with $92 million in outflows, followed by Fidelity’s FETH ($51 million) and Bitwise’s ETHW ($31 million). Grayscale’s ETHE and Mini ETH products together saw close to $50 million leave the funds.
Even though monthly net flows are still positive at $359 million, significant daily outflows often have a short-term negative impact on prices by reducing spot demand and dampening near-term market confidence.
However, on-chain data suggests selling pressure remains limited beneath the surface. In a Dec. 21 analysis shared by CryptoQuant contributor Arab Chain, data shows Ethereum exchange reserves have fallen to around 16.2 million ETH, the lowest level since 2016.
According to the same analysis, reserves on Binance steadily decreased, with balances falling from roughly 4.17 million ETH at the beginning of 2026 to roughly 4.0 million ETH. Long-term holding patterns, which may sustain prices over the medium to long term, are more commonly linked to this pattern.
Ethereum price technical analysis
Ethereum’s price structure weakened after it dropped below the $3,000 mark, which had acted as a temporary support during recent consolidation. The latest rally peaked at about $3,400 after being rejected close to the upper Bollinger Band, and then it gradually moved toward the middle of the band.
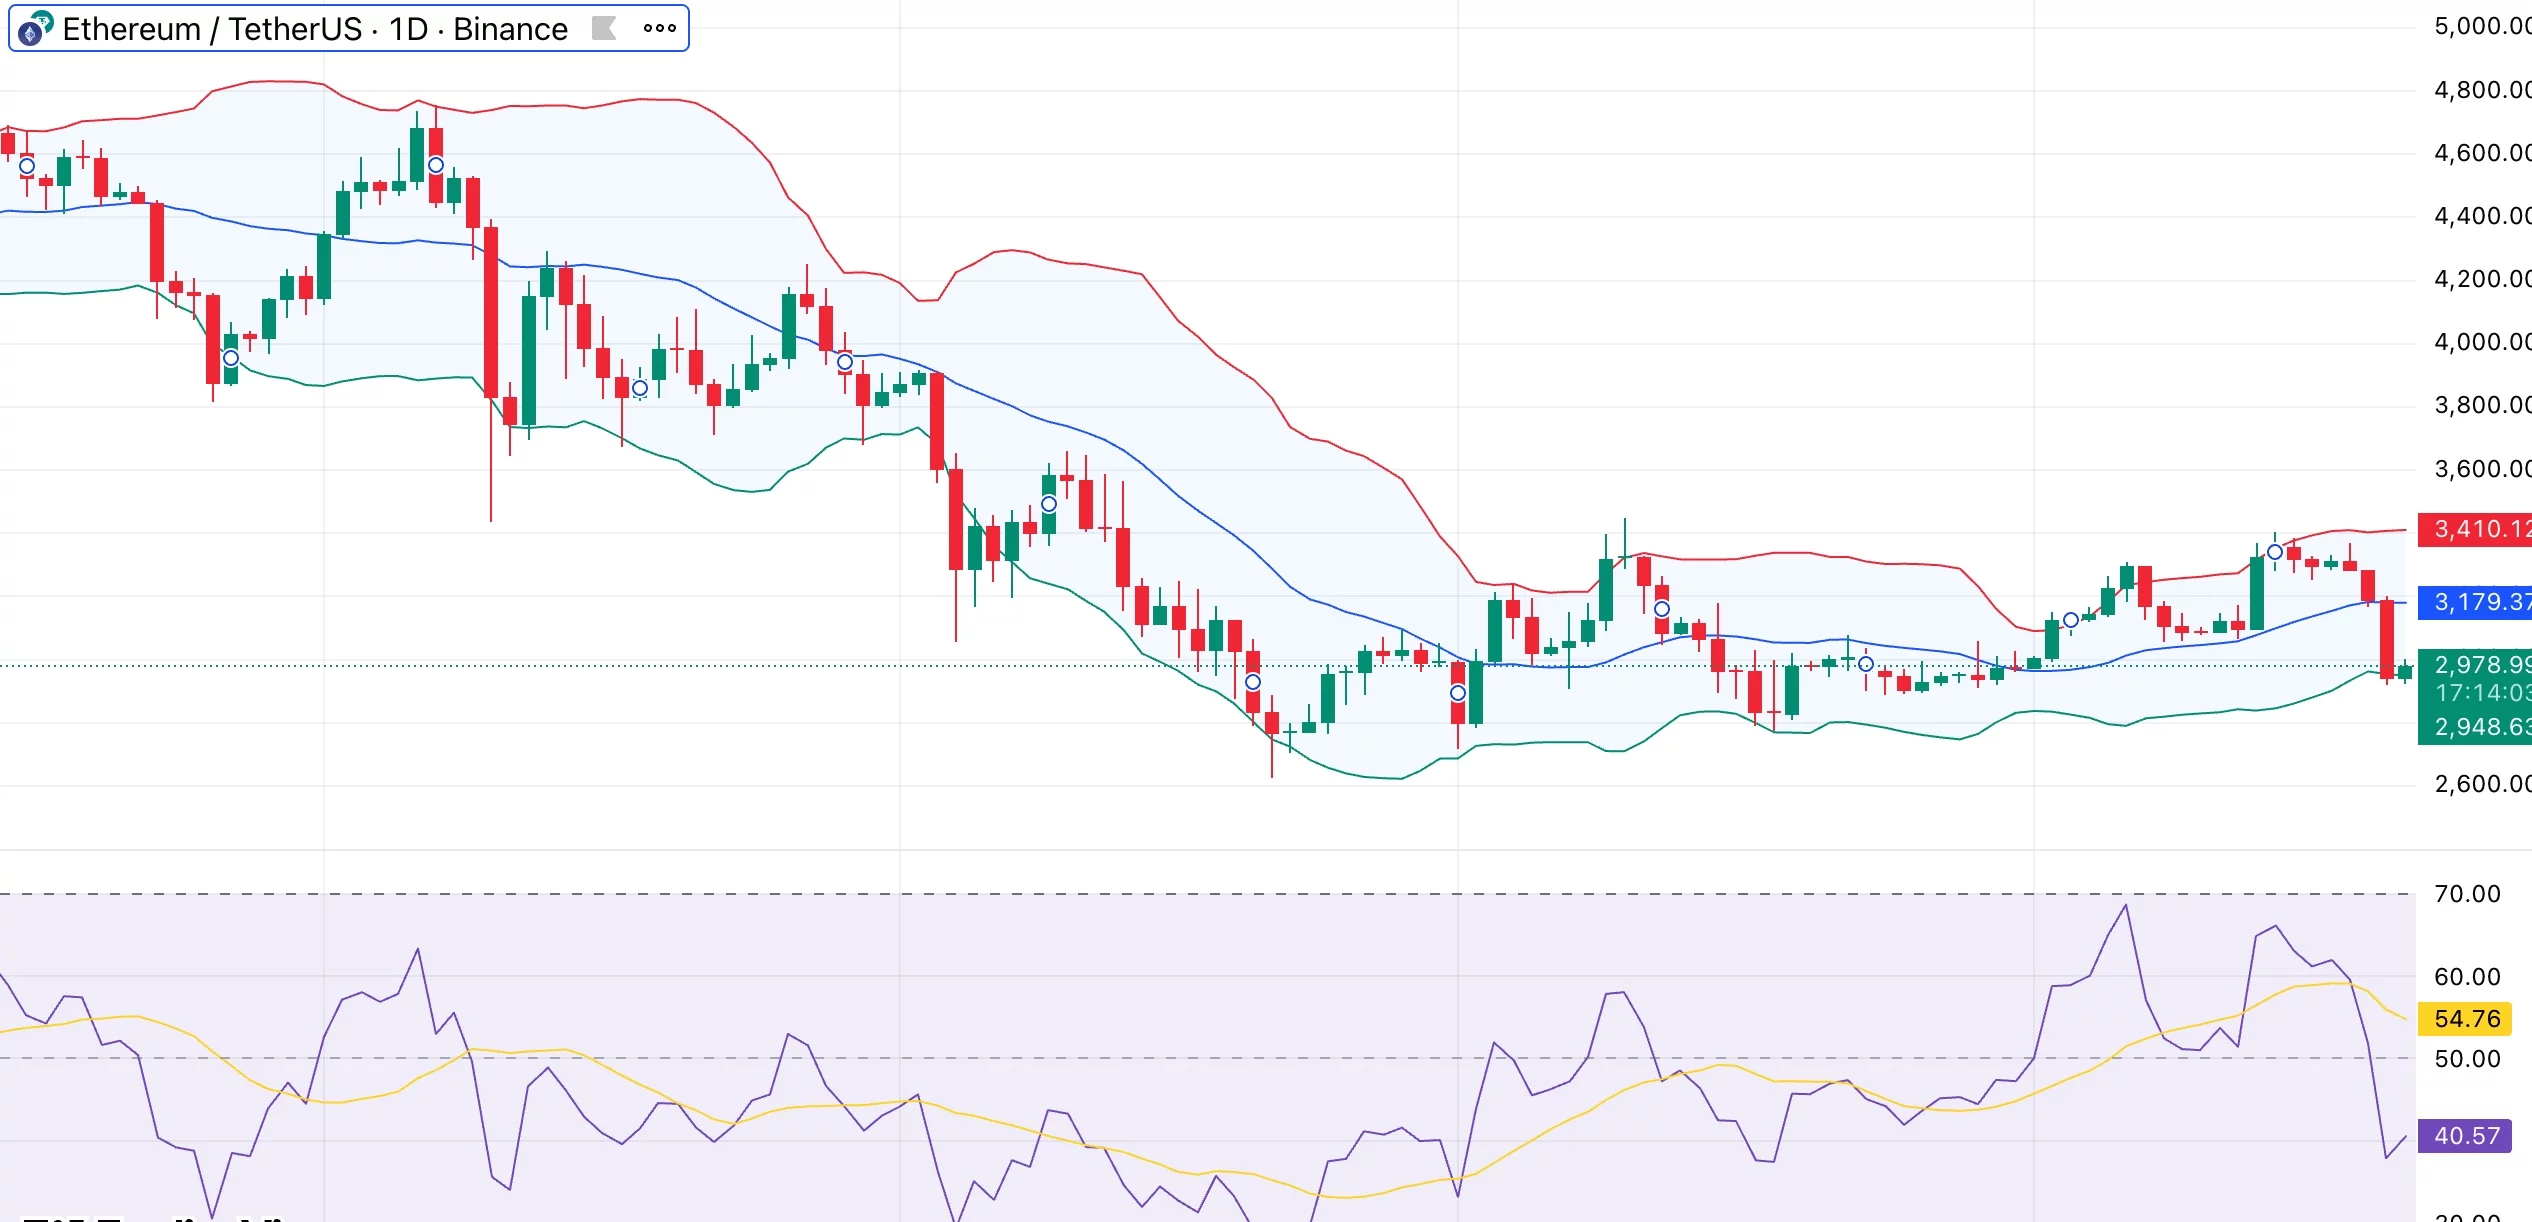
The price has now dropped below the 20-day moving average, a level that previously limited pullbacks, indicating that short-term bullish control is fading. After several weeks of narrow trading, volatility is starting to rise, indicating that the market may be moving into a more active phase.
Momentum indicators support this view. The relative strength index has slipped into the low 40s, showing that momentum is easing, even though it’s not quite in oversold territory. Should the decline continue, the $2,900–$2,950 range stands out as a key support area, reflecting both previous demand levels and the lower Bollinger Band.
The technical structure would be strengthened and a move toward $3,200 would be made possible by recovering $3,000 and surpassing short-term averages. A clear break below $2,900 on the downside could result in more drops towards the $2,750–$2,800 range before more buying interest emerges.