Ethereum price breaks six-year trend with sharp February decline


Ethereum price has crashed, making it one of the worst-performing blue-chip cryptocurrencies in February.
Ethereum (ETH) dropped to a low of $2,075, its lowest level since January 2024 and about 50% below its highest level in November 2023. The ongoing decline has broken the second-largest cryptocurrency’s six-year track record. This marks the first February decline for Ethereum since 2018 and its worst February performance on record.
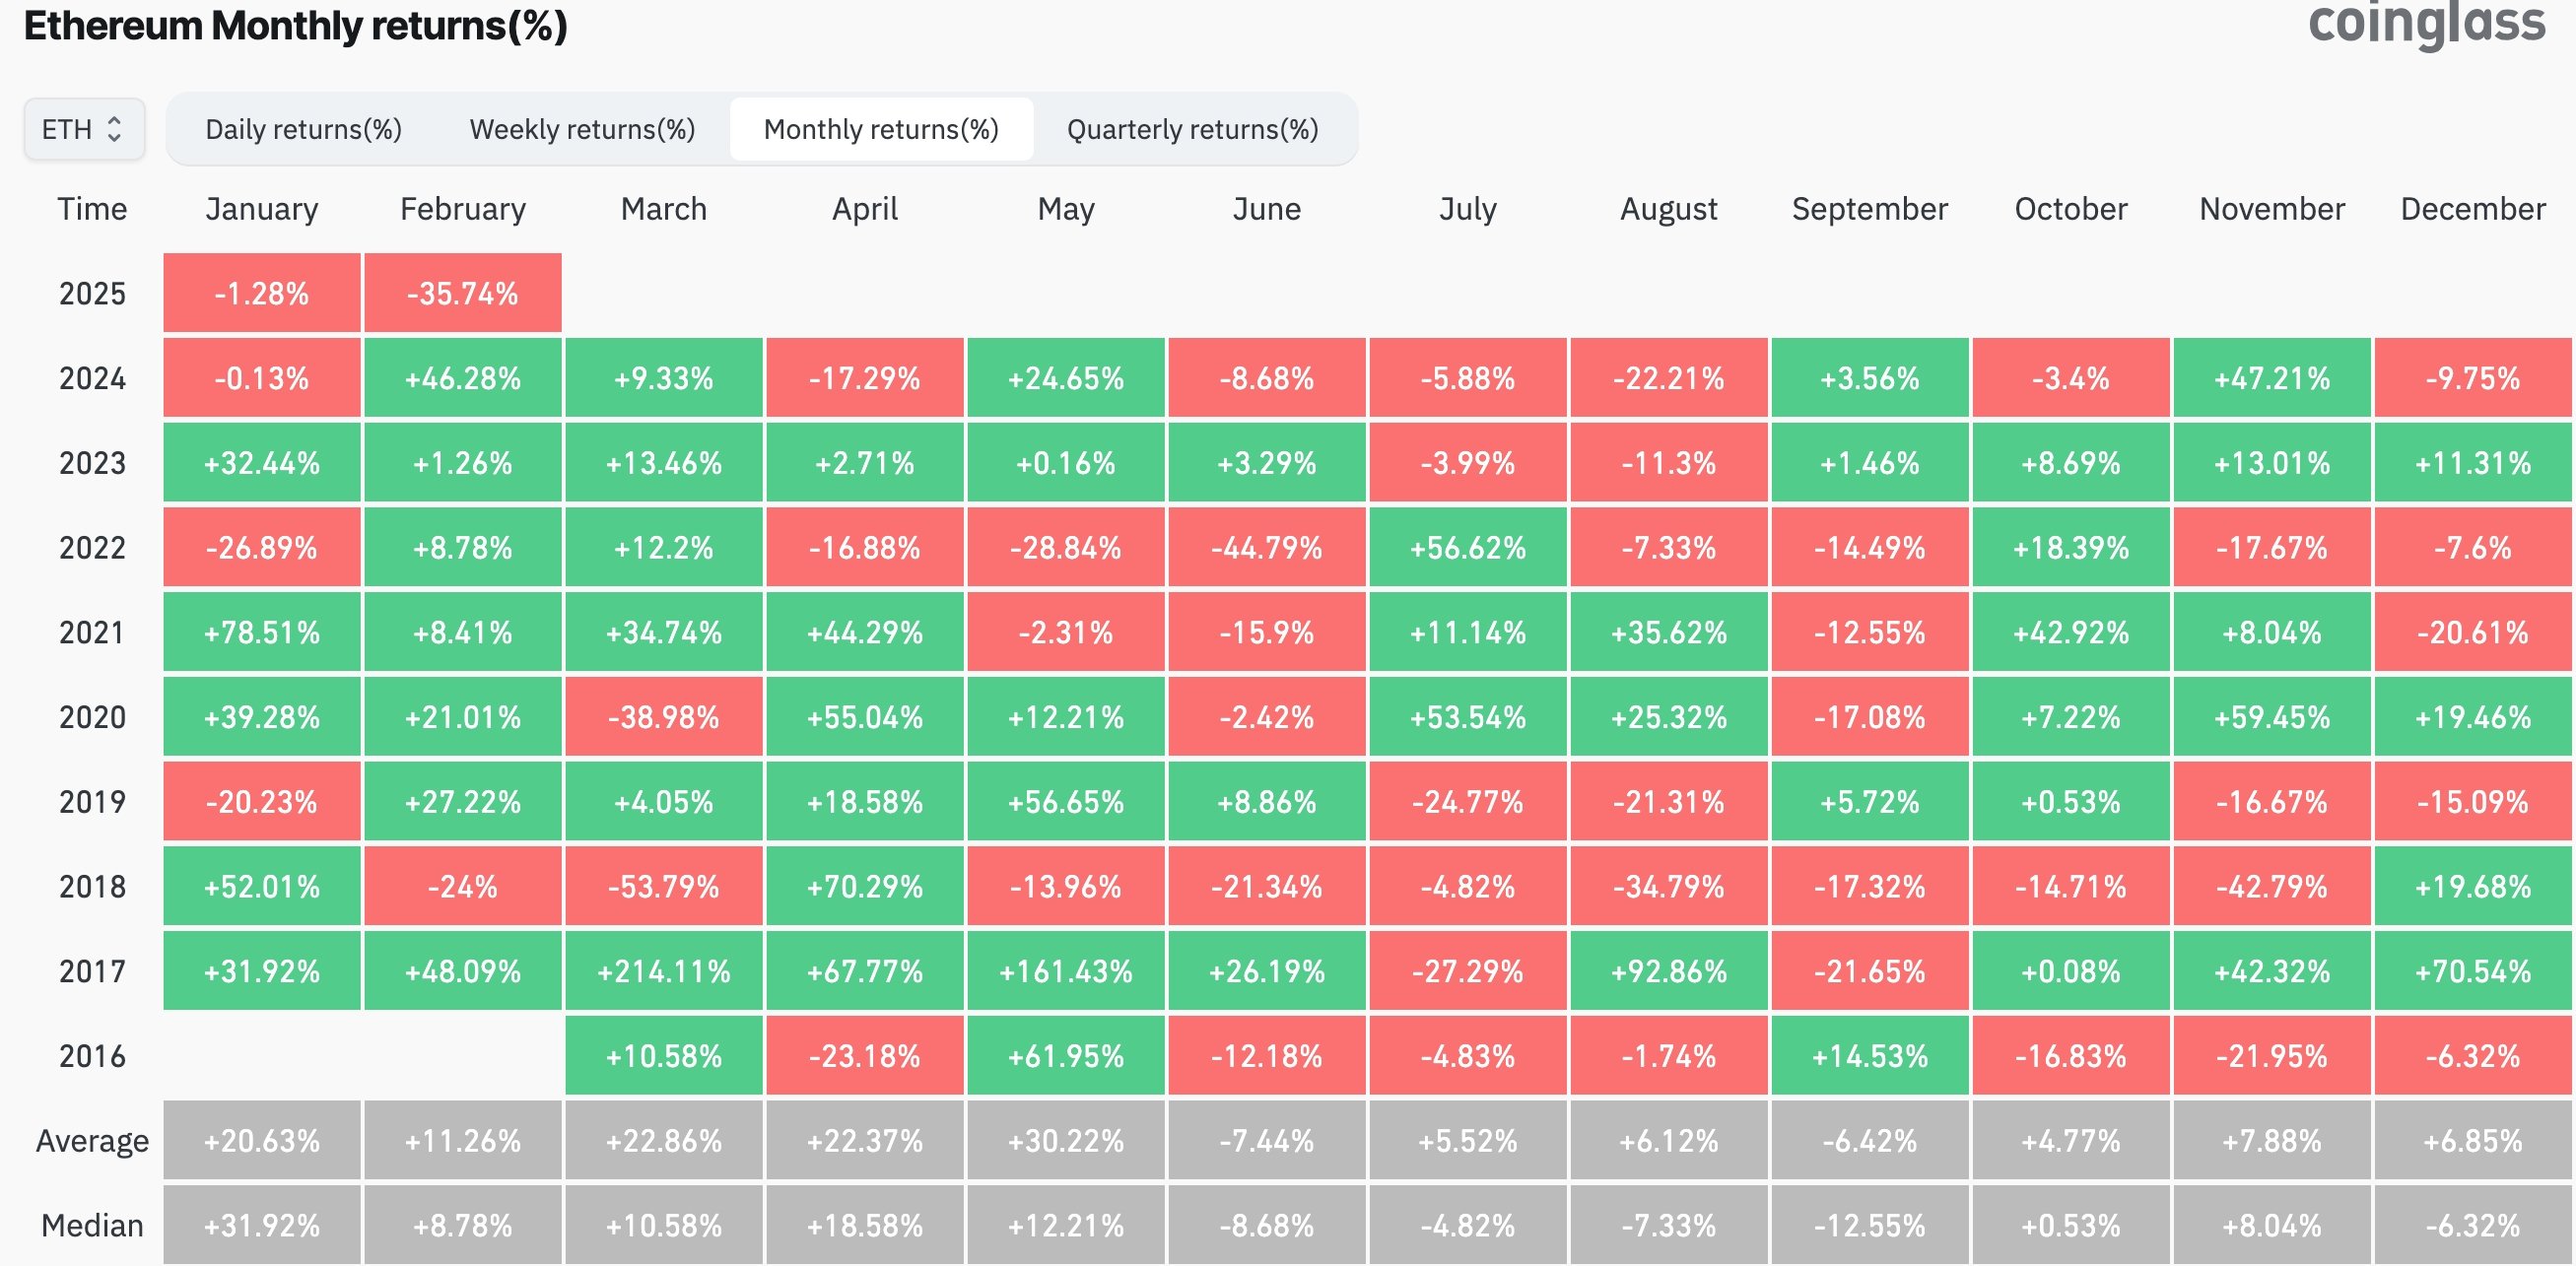
Ethereum’s decline has been more severe than that of its largest rivals. Bitcoin (BTC) has fallen by 25% from its highest level this year, while Ripple (XRP) is down around 40% in the same period.
Ethereum has dropped partly due to ongoing outflows in the exchange-traded fund. All spot Ethereum ETFs have seen asset losses for six consecutive days, bringing cumulative assets in these funds to $2.86 billion. Similarly, spot Bitcoin ETFs have shed over $4 billion worth of assets.
Ethereum has also struggled as it continues to lose market share to other layer-1 and layer-2 projects. The most notable competitors include layer-1 networks like Solana (SOL) and BNB Smart Chain, as well as layer-2 networks such as Base and Arbitrum.
The broader crypto market fear has also contributed to Ethereum’s downturn, with the Fear & Greed Index dropping to 33.
Ethereum price loses key support as it forms a death cross
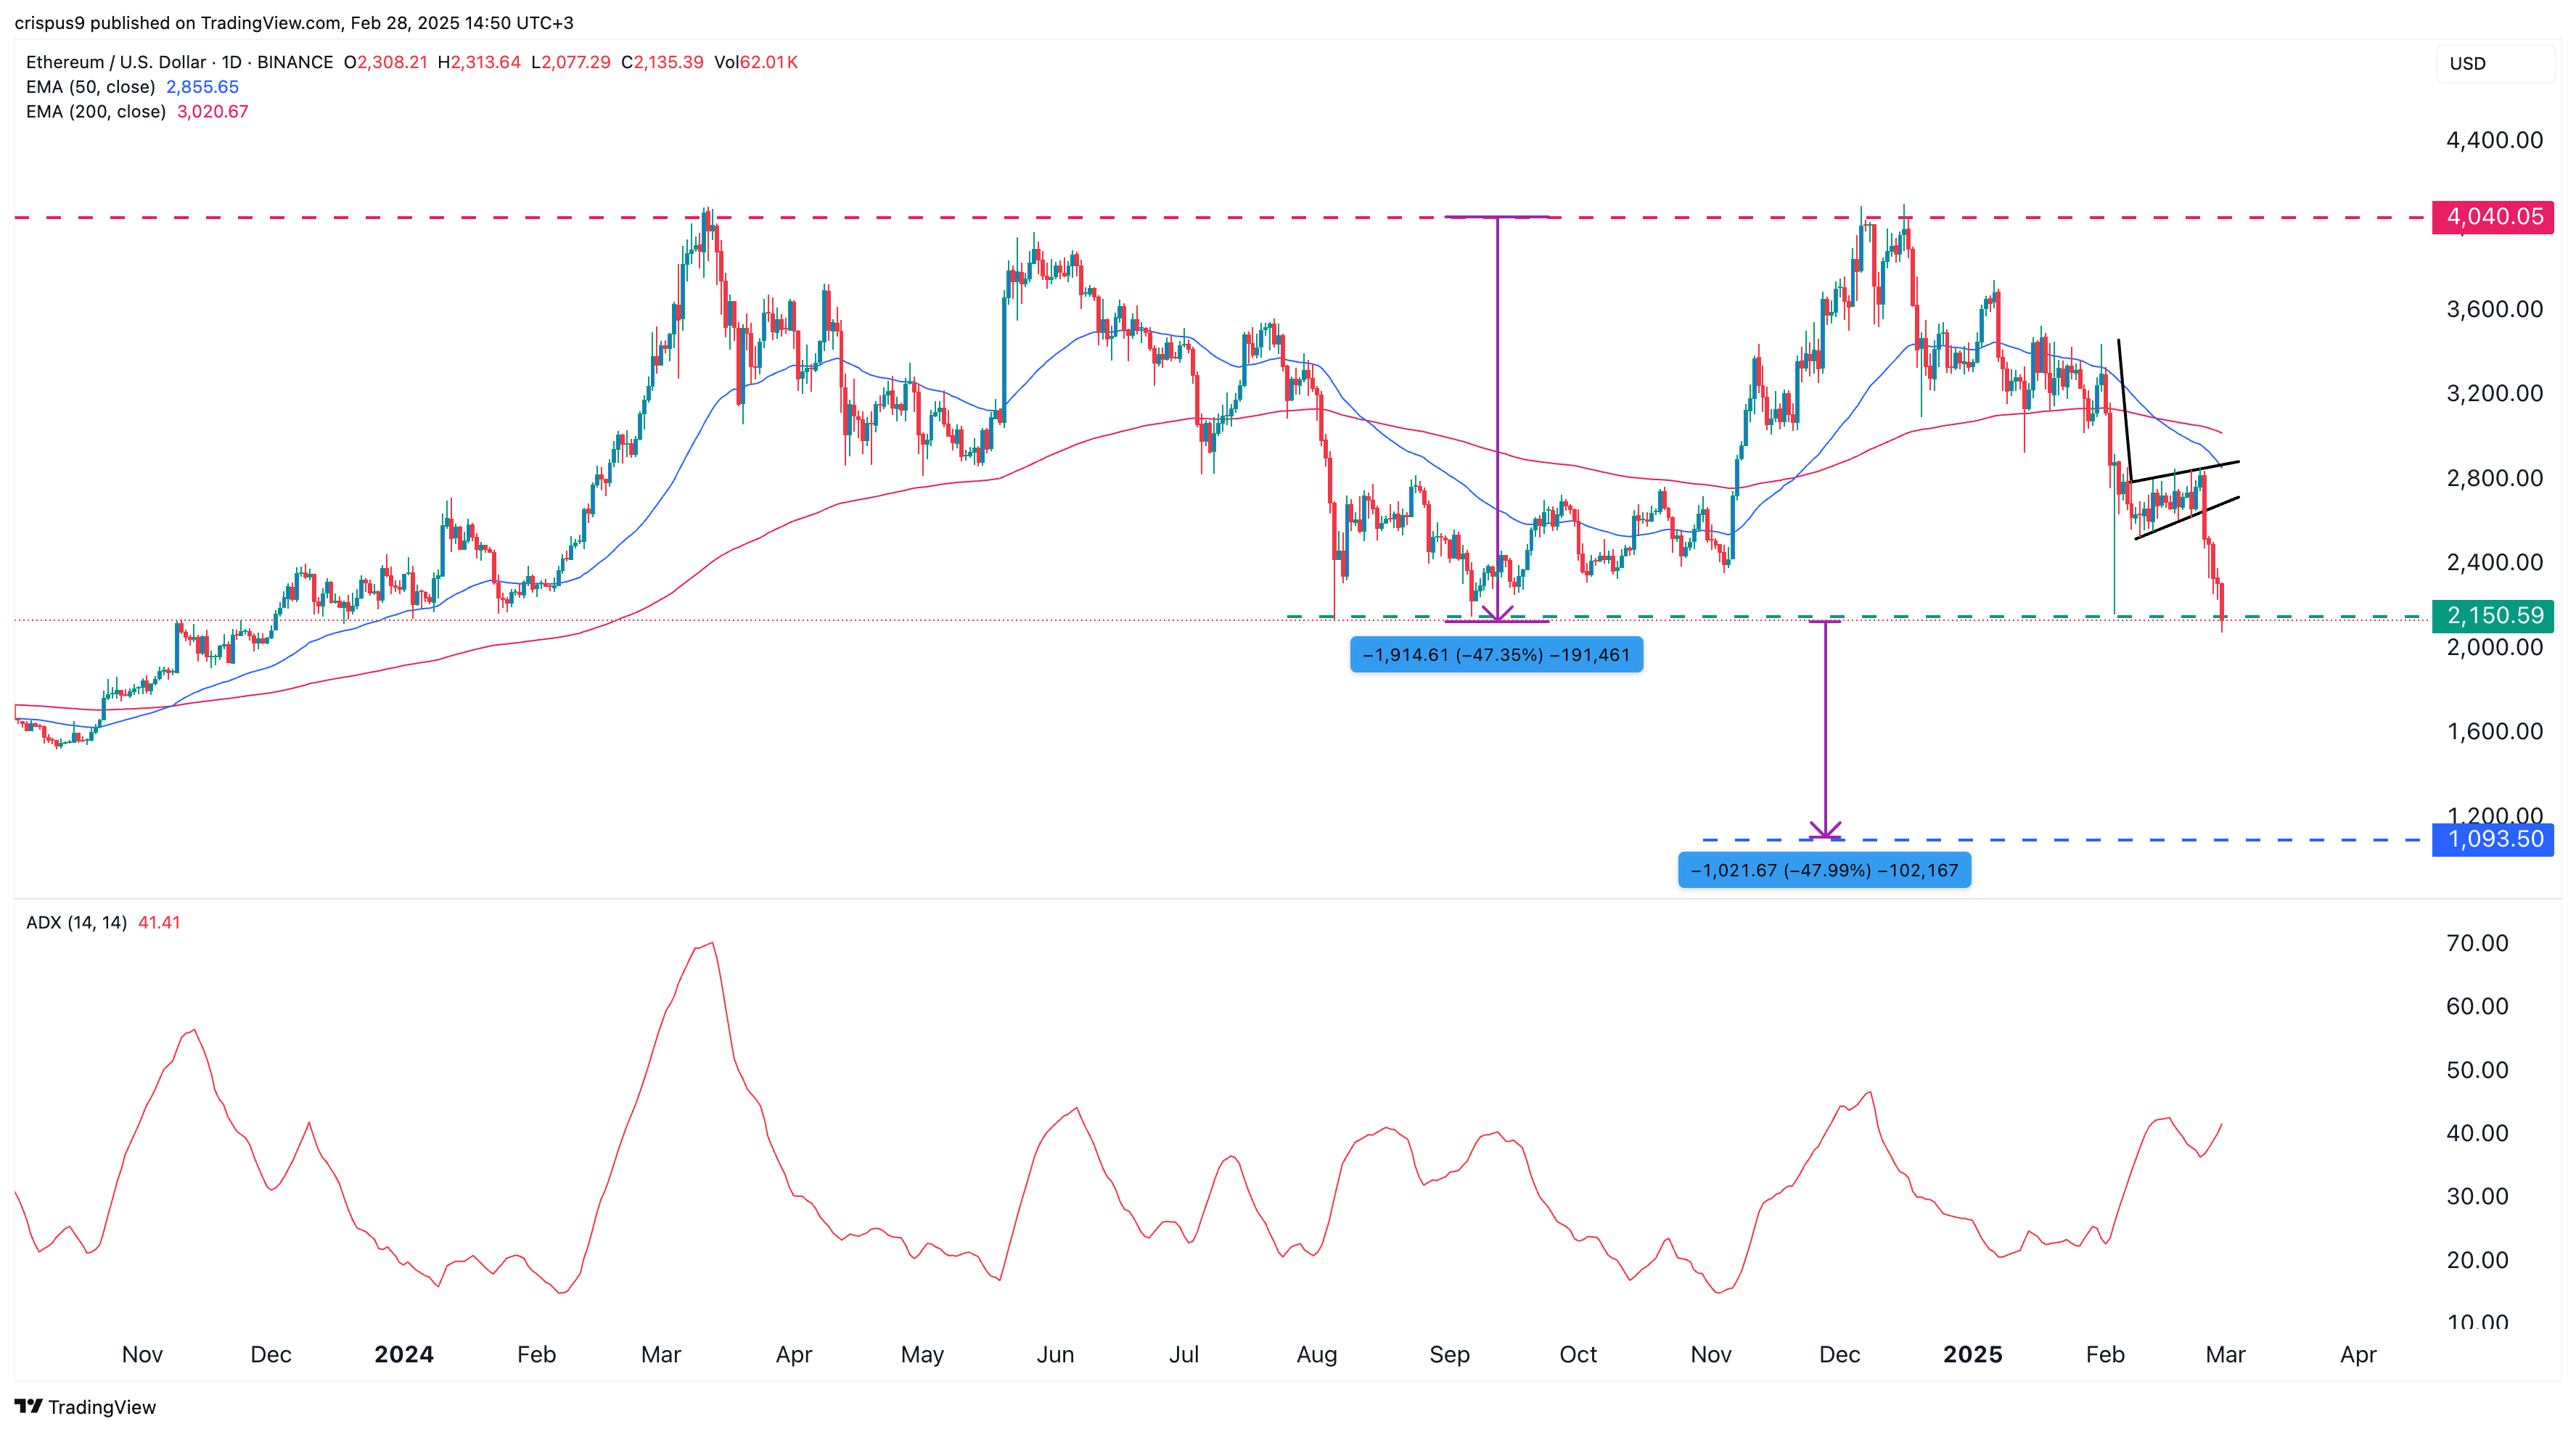
ETH price has continued crashing, as predicted in our earlier analysis, where we cited the bearish flag chart pattern. A flag pattern consists of a long vertical move followed by consolidation. This consolidation formed a rising wedge pattern, a well-known bearish continuation signal.
Worse, Ethereum has just formed a death cross, which occurs when the 200-day moving average crosses below the 50-day moving average. This is considered one of the most bearish technical patterns in the market.
Ethereum has also lost the key support level at $2,150, which previously marked the lowest swing in August and September 2023. This price served as the neckline of the triple-top pattern at $4,000.
Additionally, the Average Directional Index has risen to 40, indicating that downward momentum is strengthening.
Given that the distance between the triple-top pattern and the neckline at $2,150 is 47%, applying the same measure downward suggests that Ethereum’s price could crash to $1,095.