Bitcoin
Bitcoin (BTC)
$84,581.00 -0.89984
Bitcoin price
Ethereum
Ethereum (ETH)
$1,590.88 -1.37103
Ethereum price
BNB
BNB (BNB)
$595.65 0.49822
BNB price
Solana
Solana (SOL)
$133.85 -1.25952
Solana price
XRP
XRP (XRP)
$2.08 -0.9253
XRP price
Shiba Inu
Shiba Inu (SHIB)
$0.0000124 3.17308
Shiba Inu price
Pepe
Pepe (PEPE)
$0.0000073 -2.15029
Pepe price
Bonk
Bonk (BONK)
$0.0000121 -0.32691
Bonk price
dogwifhat
dogwifhat (WIF)
$0.400144 0.74539
dogwifhat price
Popcat
Popcat (POPCAT)
$0.237494 -11.04158
Popcat price

Ethereum price bullish pattern points to a 35% surge

Jayson Derrick
Edited by
Markets
Ethereum price bullish pattern points to a 35% surge

Ethereum’s price was in a tight range this week as crypto investors remained on the sidelines and exchange-traded fund outflows rose.

Ethereum (ETH) was trading at $1,580 on Friday, where it has remained throughout the week. It has risen by 14% from its lowest point this month.

Ethereum continues to face many challenges, especially the rising competition from layer-2 networks like Base and Arbitrum (ARB). Other layer-1 networks like Sui (SUI) and Solana (SOL) have continued to gain market share in industries like decentralized finance and gaming. 

Most tellingly, spot Ethereum ETFs have continued to shed assets this year. These funds attracted zero inflows on Thursday, following seven consecutive days of net outflows. 

They have now experienced outflows for eight consecutive weeks, bringing the cumulative net outflow to $2.24 billion, a sign that these funds are not gaining traction among investors.

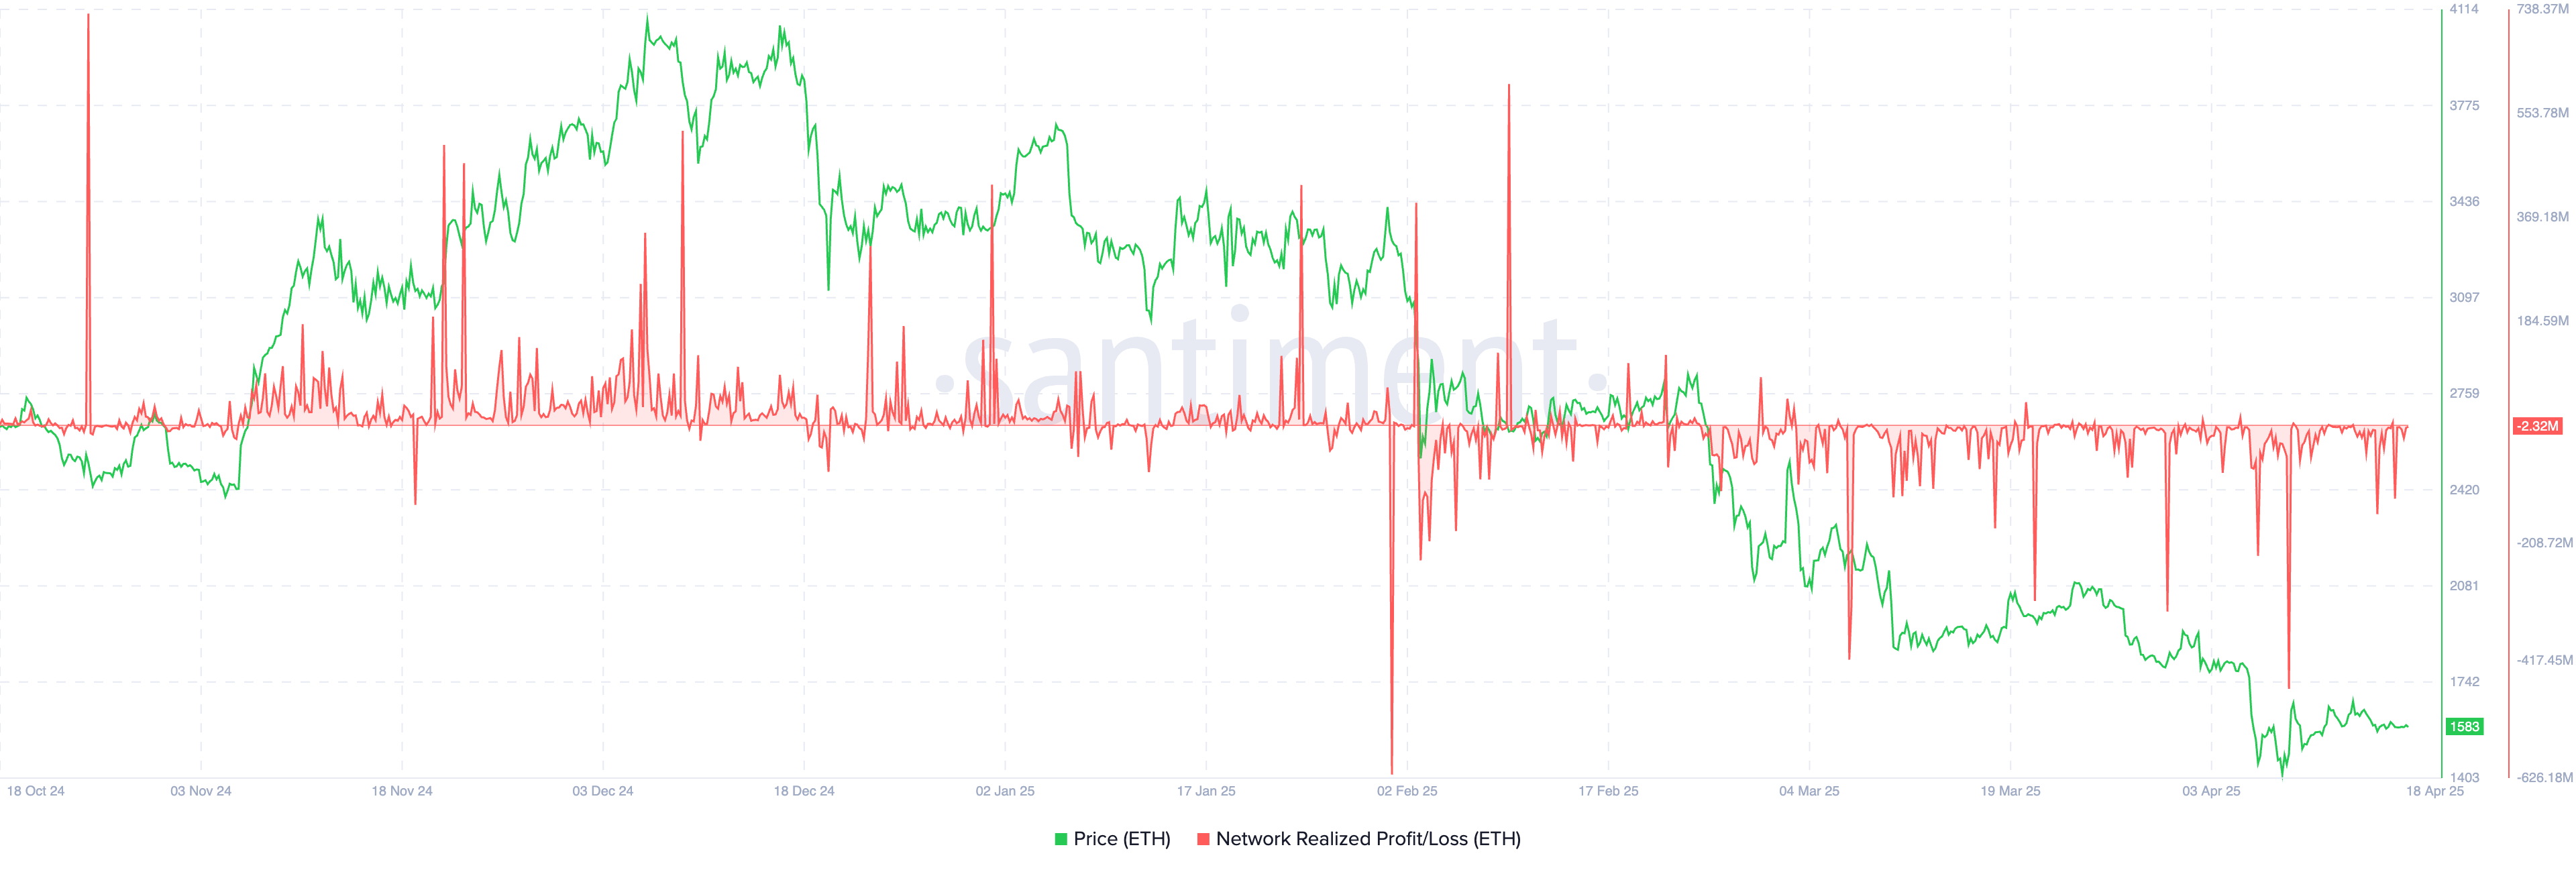
Further data shows that some Ethereum investors have started to capitulate by selling their holdings at a loss. The chart below shows that the Network Realized Profit/Loss has remained in the red for a while. This metric measures the net profit or loss of all coins moved on the blockchain.

ETH NRP data
ETH NRP data | Source: Santiment

Ethereum price technical analysis

Ethereum price
ETH price chart | Source: crypto.news

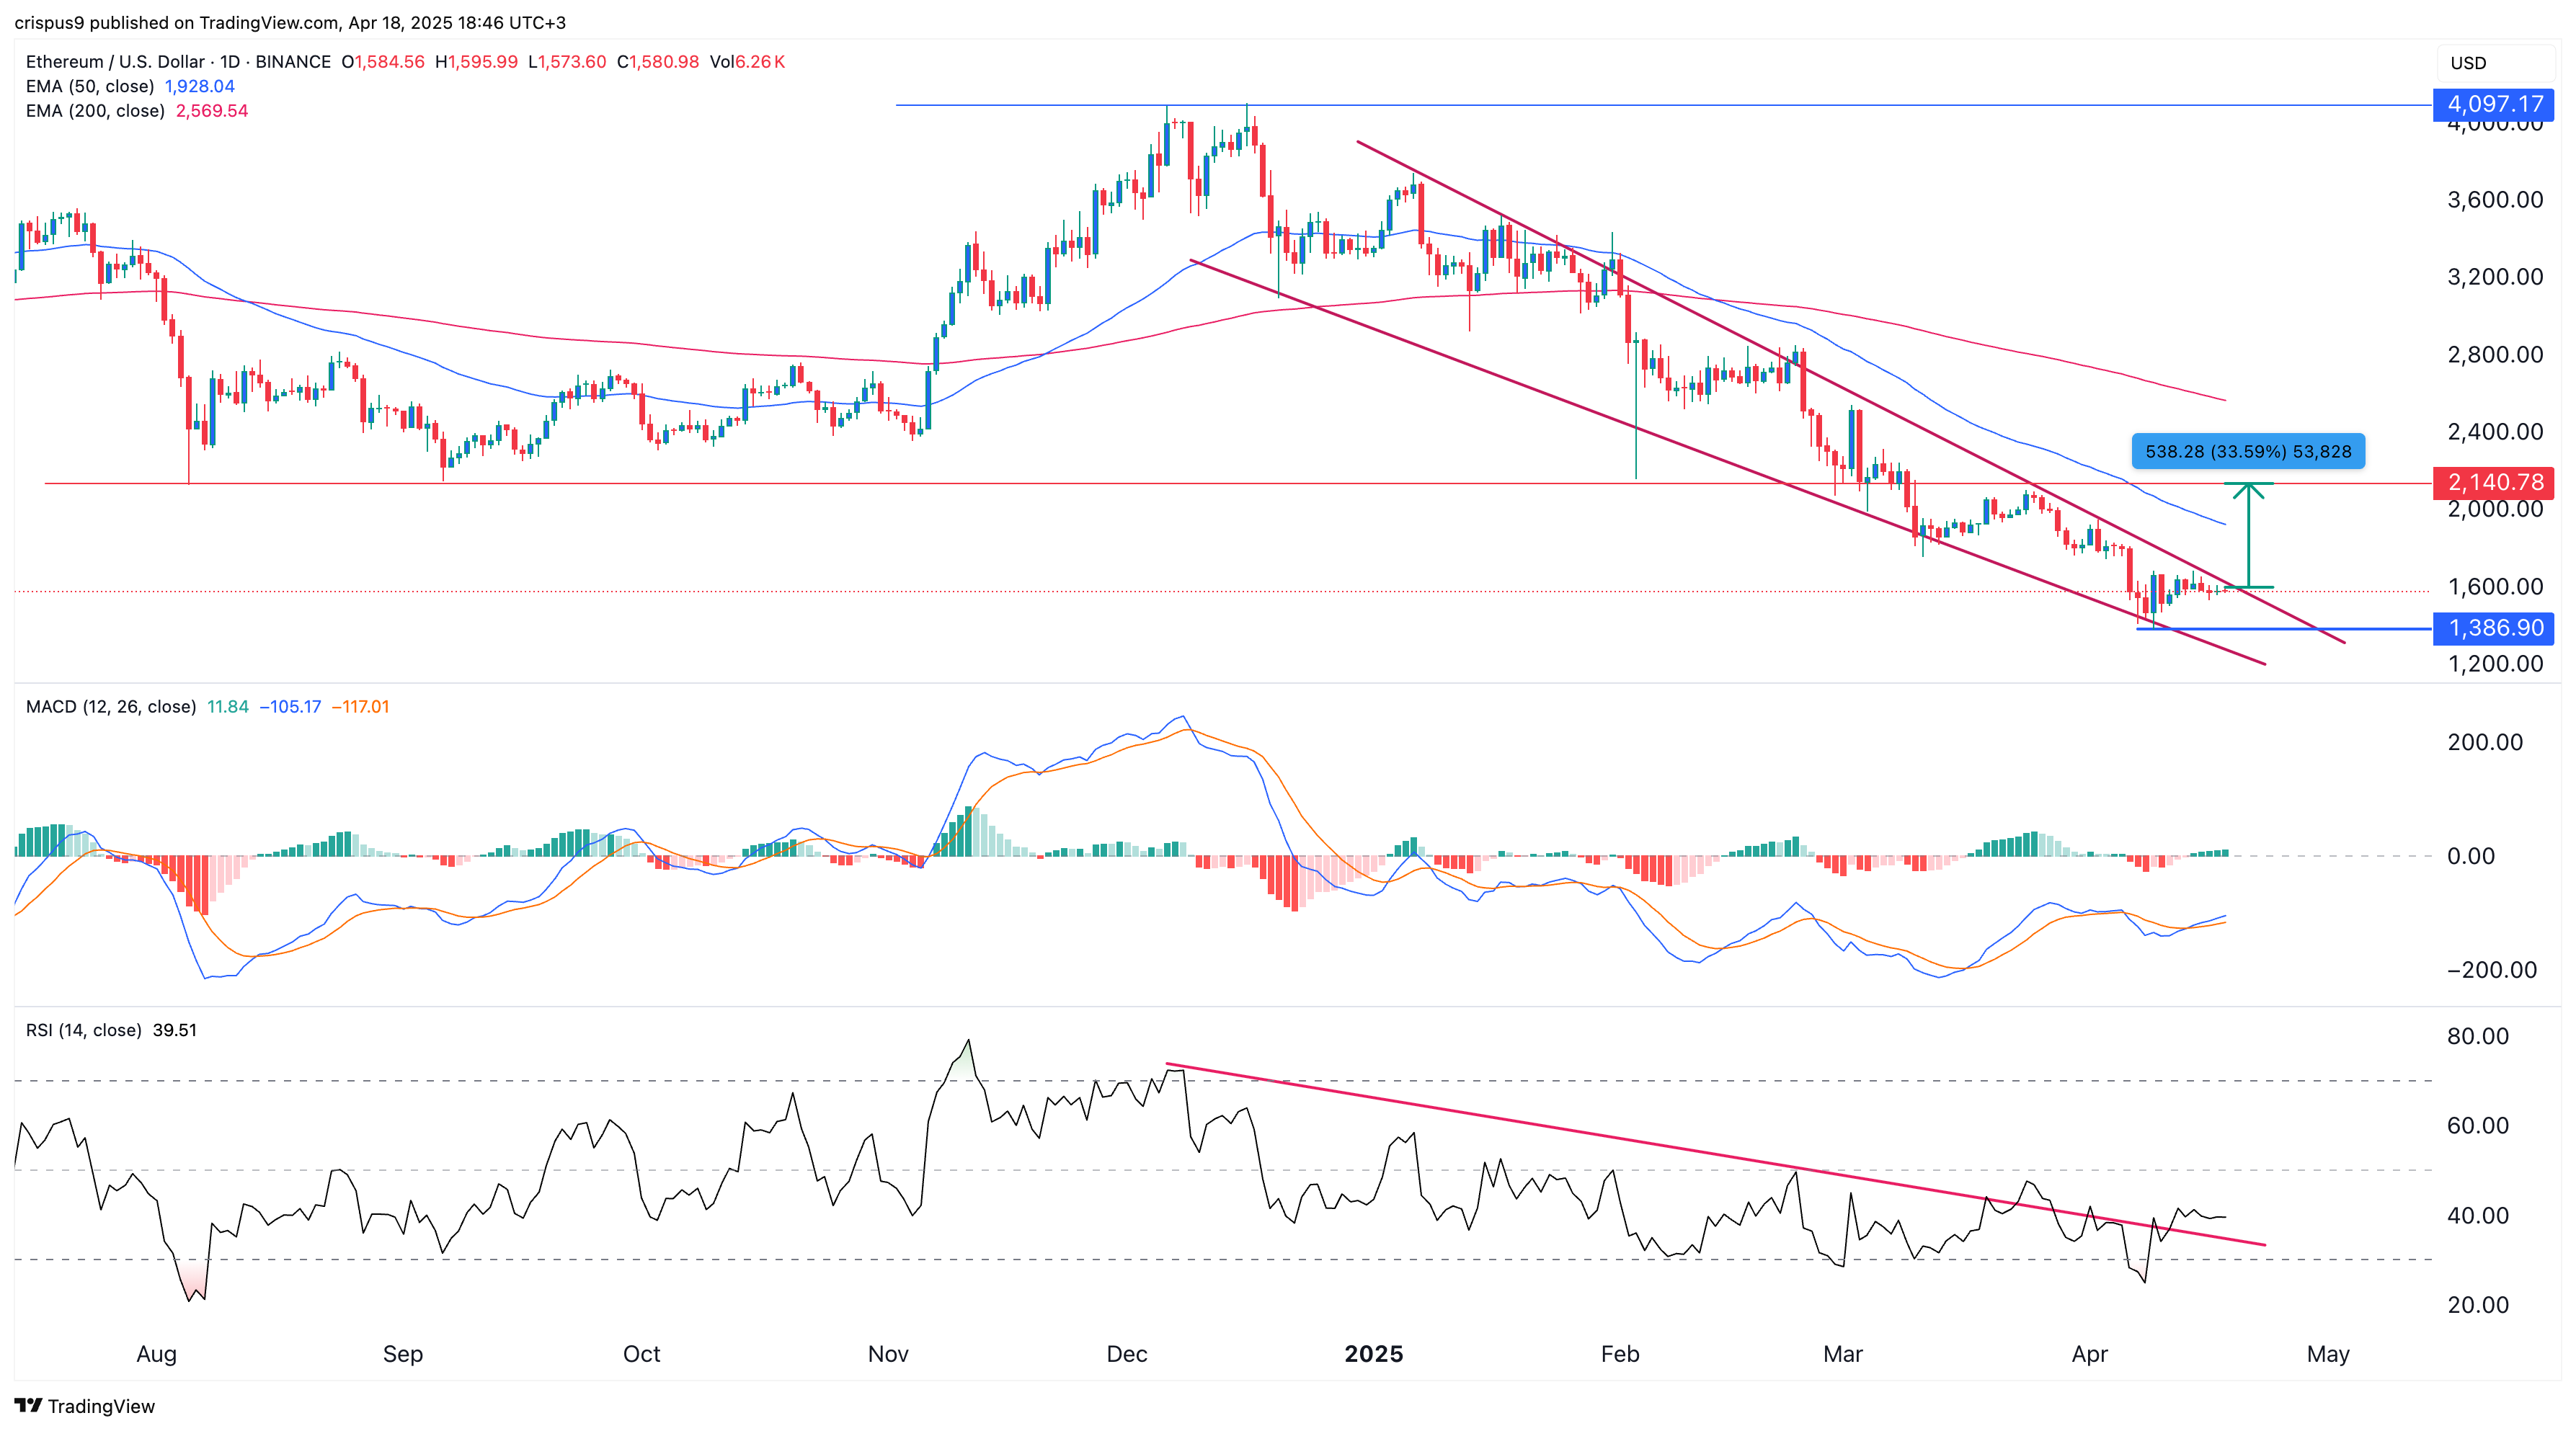
The daily chart shows that Ethereum remains in a strong bearish downtrend after peaking at $4,100 last year. It continues to trade below both the 50-day and 200-day Exponential Moving Averages and below the key support level at $2,140. This support is notable since it was the neckline of the triple-top pattern on the weekly chart. 

On the positive side, Ethereum has formed a bullish divergence pattern as the two lines of the MACD continue to rise. The Relative Strength Index has also moved slightly above the descending trendline.

The coin has also formed a giant falling wedge pattern, comprising two descending and converging trendlines. As these lines approach convergence, there is a likelihood of a strong bullish breakout in the near term. If this happens, the next level to watch will be $2,140, the lowest swing in August and September last year. This target is about 35% above the current level.