Ethereum price chart still bullish amid BitMine ETH purchases


Ethereum price has crashed into a bear market in the past few weeks, but technicals and treasury purchases point to a strong comeback in the near term.
- Ethereum price has pulled back and moved into a bear market this year.
- The coin has formed a bullish flag pattern on the daily chart.
- Companies like BitMine have continued to accumulate Ether tokens.
At last check Saturday, Ethereum (ETH) traded at around $3,860, down by over 22% from the year-to-date high of $4,965, but up about 2.4% over the past 24 hours.
Ethereum price has numerous fundamental and technical catalysts that will boost its performance. One key catalyst is that Tom Lee’s BitMine is continuing its buying spree.
The company bought more coins this week, bringing its total holdings to over $6.6 billion. Lee has maintained his bullish Ethereum forecast and hinted that BitMine will continue accumulating in the coming months.
SharpLink holds over 797k coins, while The Ether Machine has over 345k coins. Most notably, Huobi’s founder has committed to starting a $1 billion Ethereum treasury company.
Advocates argue that Ethereum is a better asset than Bitcoin because of its ability to generate income. Data compiled by StakingRewards shows that Ethereum has a staking yield of 3%.
Meanwhile, Ethereum ETFs did better than those tracking Bitcoin (BTC). Data shows that these funds had outflows of just $232 million this week, compared to Bitcoin, whose funds shed over $1.2 billion.
The futures market points to an Ethereum price rebound as the funding rate has remained above the neutral point. A positive funding rate is a sign that investors anticipate the price to keep going up.
Ethereum price technical analysis
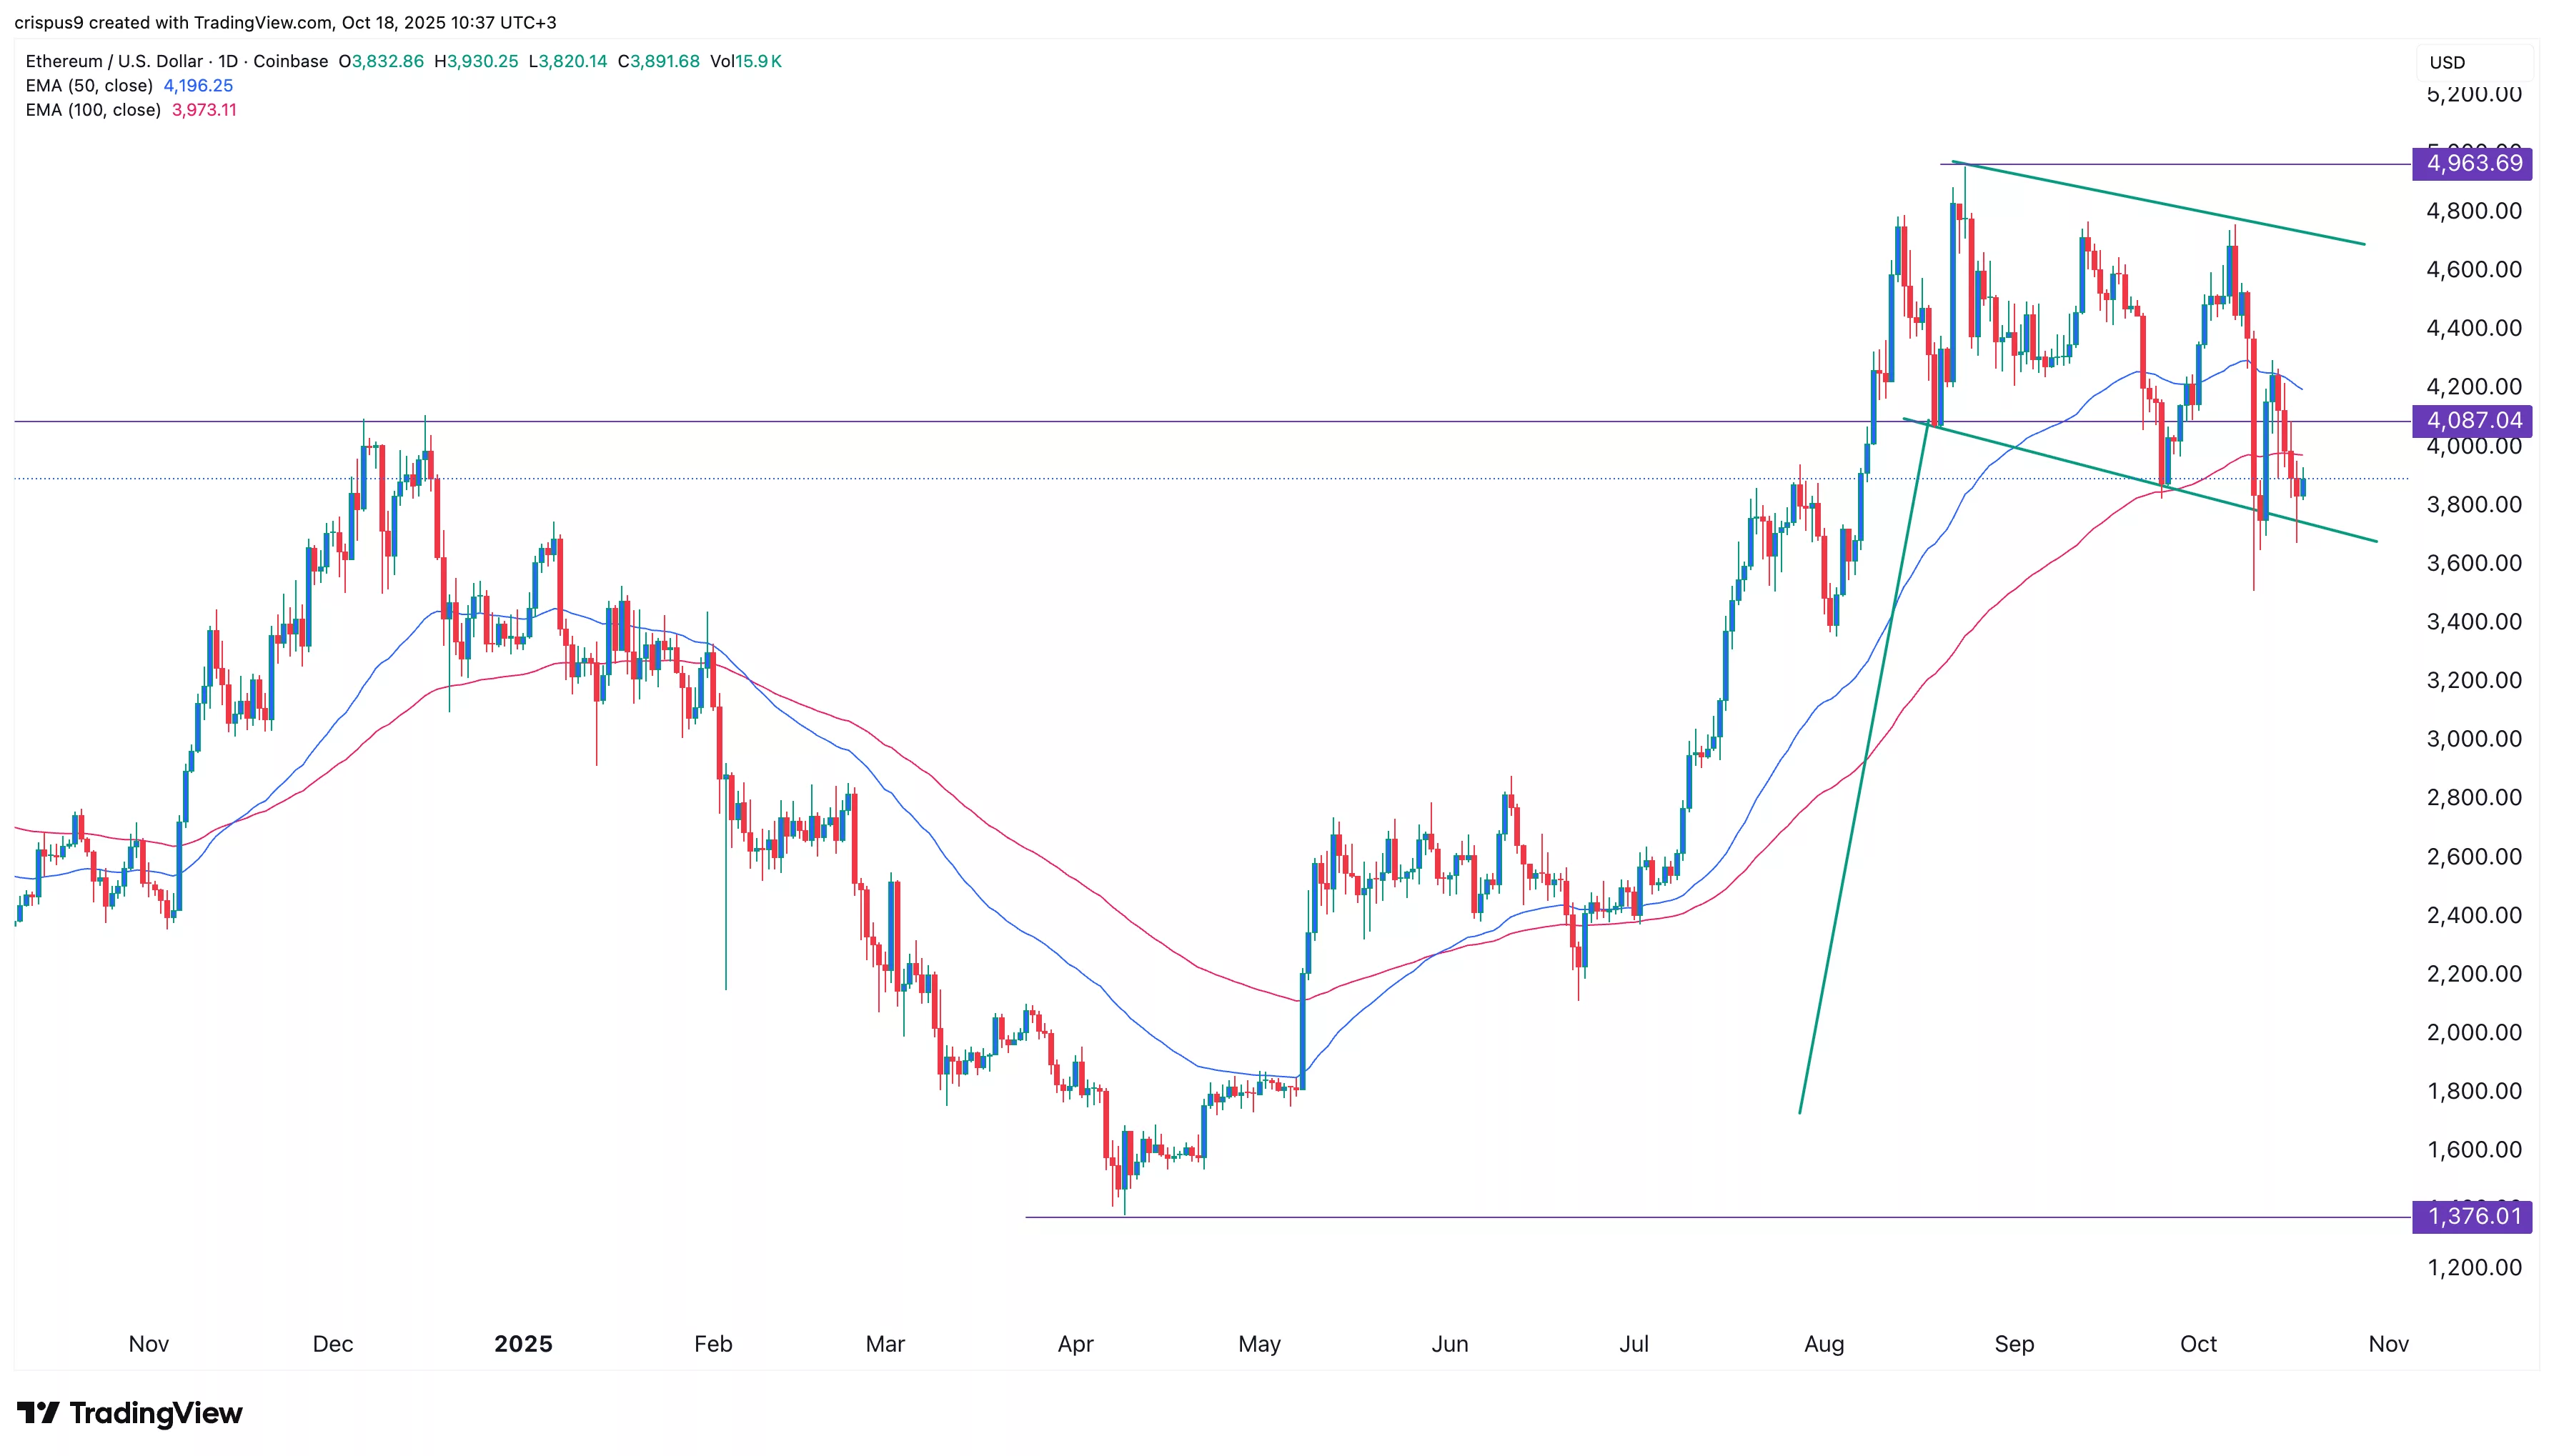
The daily timeframe chart shows that the ETH price has pulled back in the past few weeks. It has tumbled from a high of $4,963 in August to $3,900 today.
This plunge has had it move below the 50-day and 100-day Exponential Moving Averages. It also moved slightly below the key support at $4,087, its highest point in December last year.
On the positive side, the coin has formed a bullish flag pattern, which is made up of a vertical line and a descending channel.
Therefore, the Ethereum price may bounce back in the coming weeks. If this happens, it may rally and retest the year-to-date high of $4,963 followed by $5,000.
This bullish outlook will remain as long as it is inside the flag’s descending channel. A drop below the lower side of the channel will point to more downside, potentially to $3,000.