Ethereum price confirms inverted H&S as staking queue soars


Ethereum price could be preparing a strong rebound after forming a giant hammer candle and confirming the inverted head-and-shoulders chart pattern as the staking queue jumps to a record high.
- Ethereum price dropped for three consecutive weeks.
- The staking queue has jumped to a record high.
- ETH has formed an inverted head-and-shoulders pattern.
Ethereum (ETH) token was trading at $2,080, up sharply from last week’s low of $1,738. This price is much lower than the all-time high of nearly $5,000.
The ongoing Ethereum crash is notable as it is happening when the token has some of the best fundamentals ever. For example, more investors are delegating their coins to staking. Data shows that 4 million ETH coins are waiting in line to stake.
The entry queue has jumped to a record high of 4.06 million coins, while only 31,915 coins are waiting to get out. These numbers mean that the wait time to stake has jumped to 70 days. These numbers mean that there is still demand for Ethereum and that most holders are not panic-selling.
Ethereum’s network statistics are booming, a sign that the Fusaka upgrade was successful. Nansen data shows that Ethereum’s active addresses jumped by 38% in the last 30 days to over 15 million. Its transactions soared by 37% to over 70 million, while its fees soared to nearly $20 million.
Ethereum is benefiting because of its commanding market share in some of the most important industries in the crypto industry. For example, it is the biggest chain in the real-world asset tokenization industry, with a market share of over 70%.
Ethereum price technical analysis
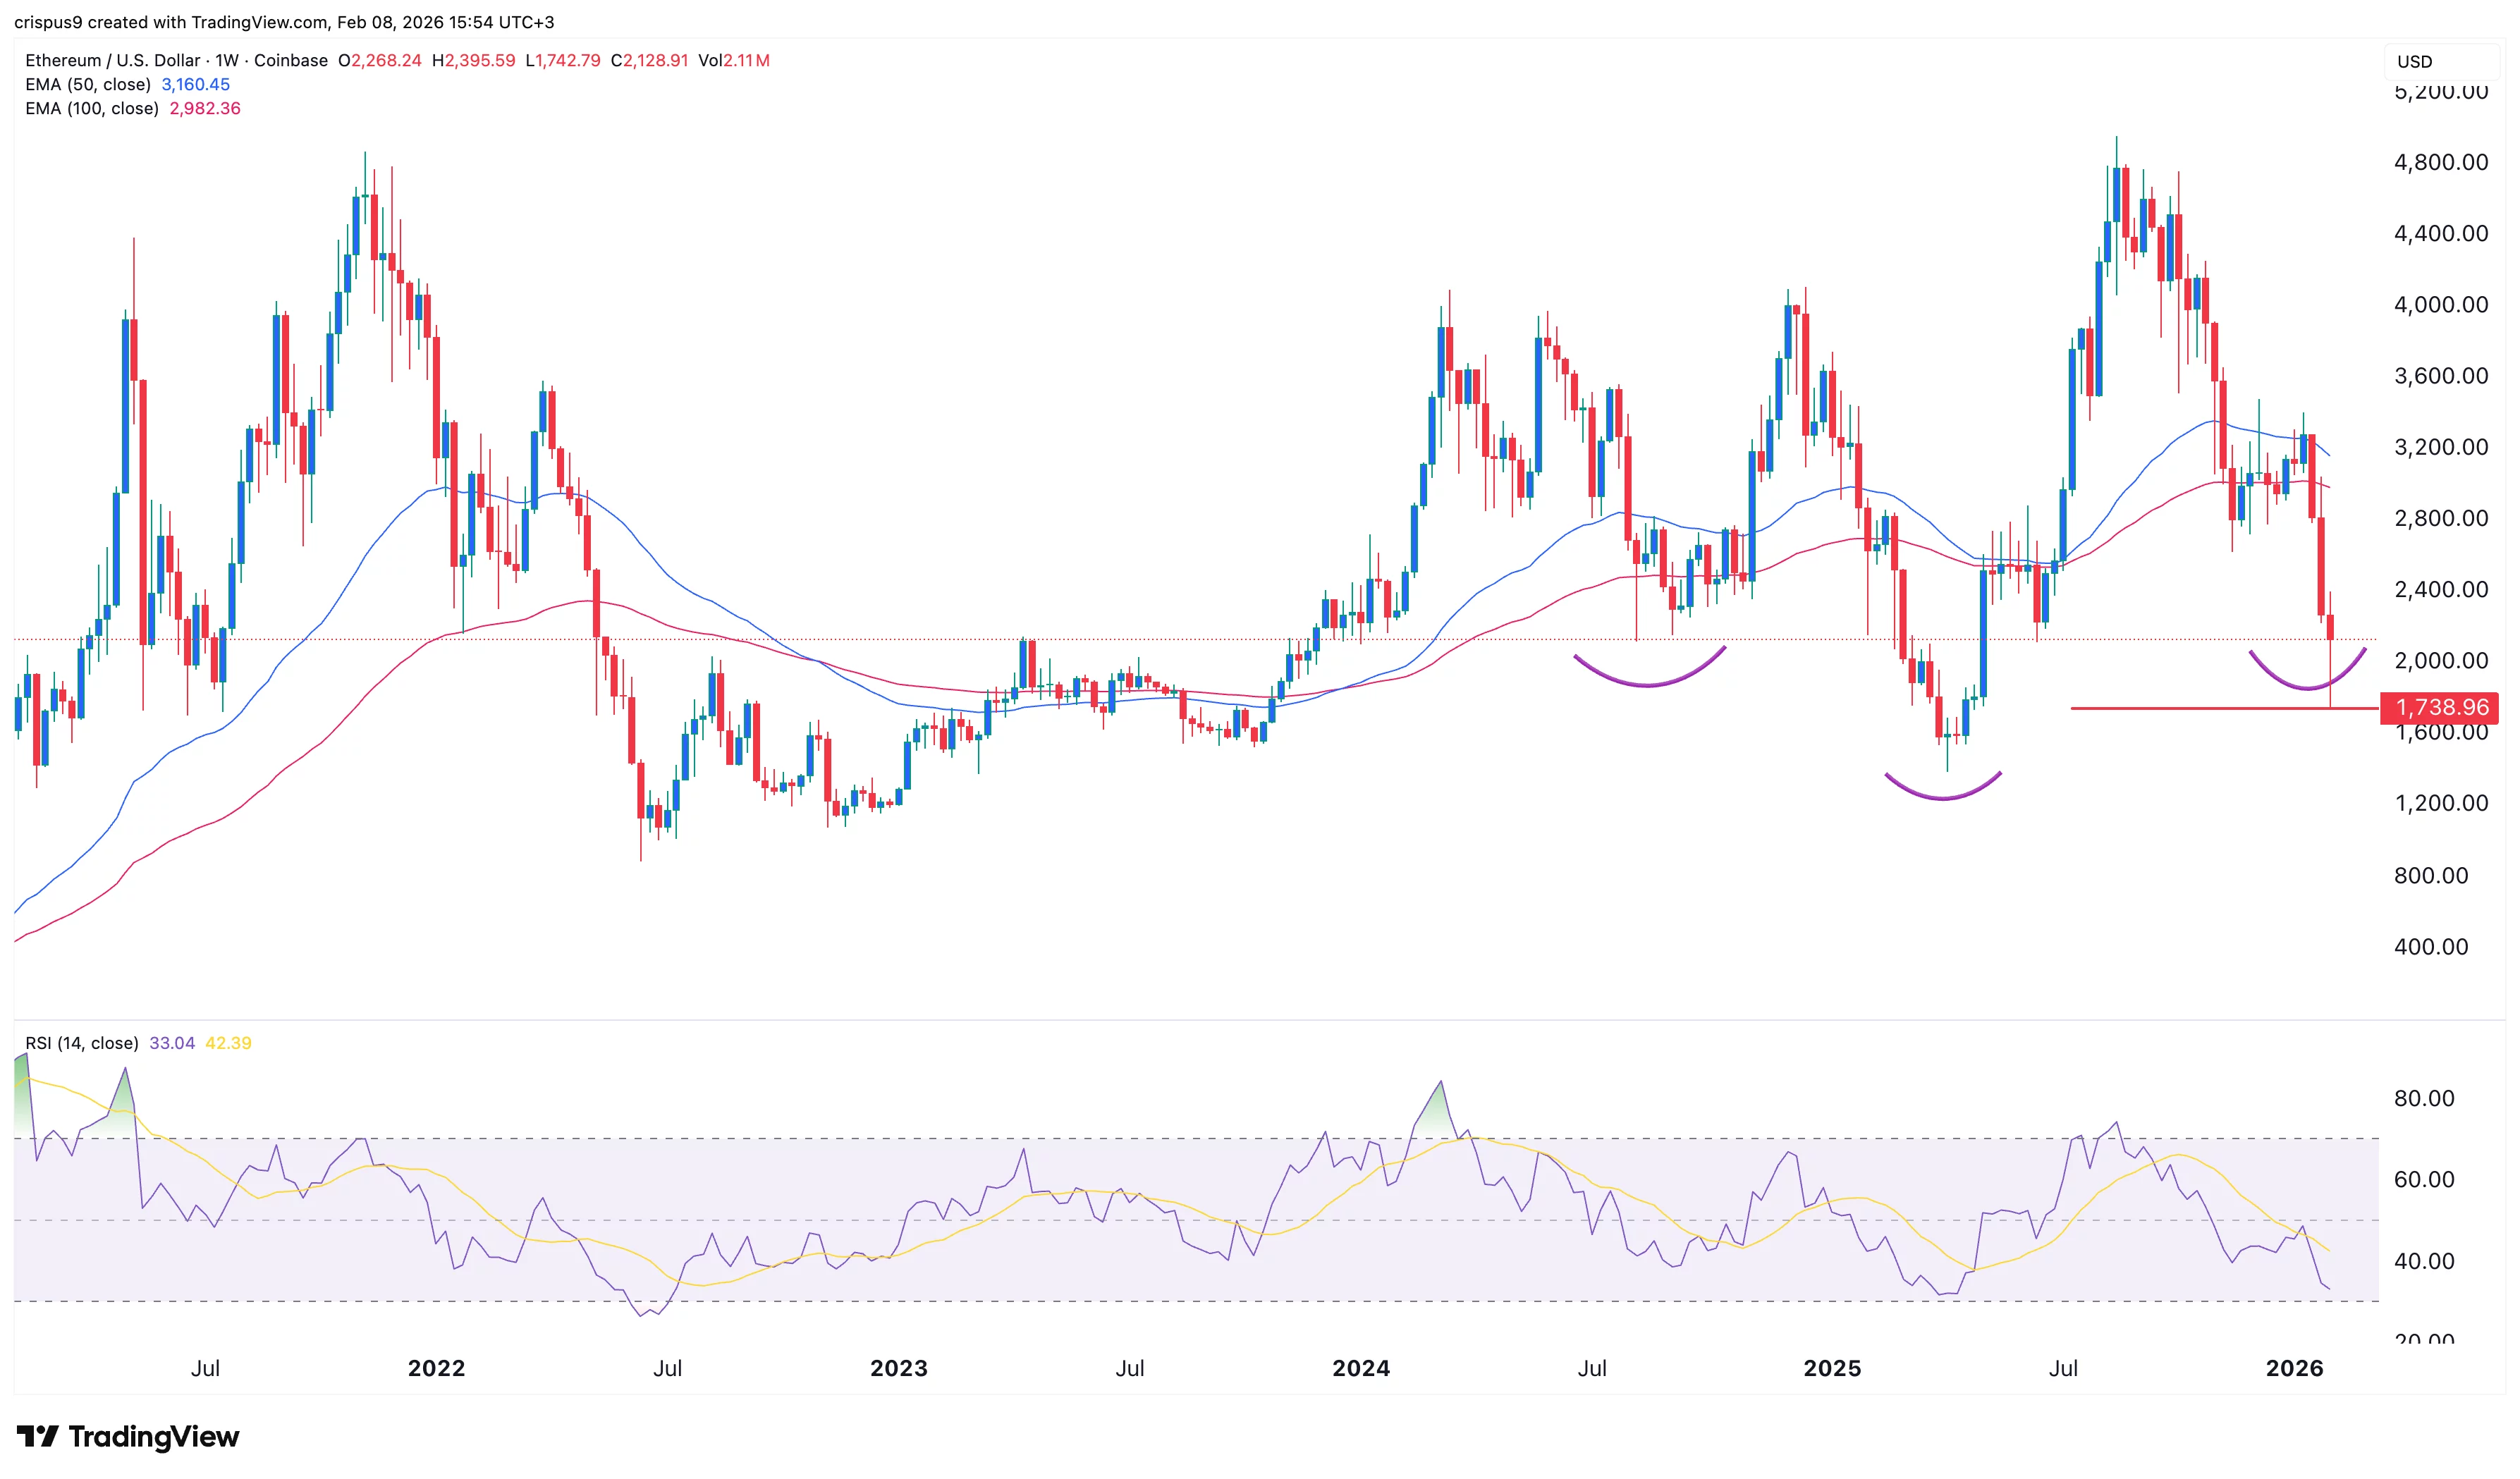
The weekly timeframe chart shows that the ETH price has been in a freefall in the past few months. It has dropped in the last three consecutive weeks, with the Relative Strength Index moving to the oversold level of 30.
The coin has been slowly forming the inverted head-and-shoulders pattern, a common bullish reversal sign. There are signs that the coin has completed the formation of the right shoulder.
It has also formed a hammer candle, which is made up of a long lower shadow and a small body. A hammer is another common bullish reversal sign in technical analysis.
Therefore, the coin will likely bounce back in the coming weeks, potentially to the psychological point at $2,500. A move below the lower side of the hammer will invalidate the bullish outlook.