Ethereum price dips below $3.9K as spot ETFs see $145M outflows, MVRV Momentum signals “death cross”


Ethereum’s slide under $3,900 has deepened as spot exchange-traded fund outflows continue and a bearish on-chain “death cross” raises fears of further downside.
- Ethereum price fell below $3,900, down 4.8% in 24 hours and 13% this month.
- Spot ETH ETFs record $145M in daily outflows, led by BlackRock and Fidelity.
- The MVRV “death cross” reappears, echoing patterns that preceded past selloffs.
Ethereum traded at $3,876 at press time, marking a 4.8% drop in the past 24 hours and extending its weekly loss to 4.6%. Over the past month, ETH has shed more than 13%, now standing 21% below its all-time high of $4,946 set on Aug. 24.
In the last 24 hours, Ethereum’s (ETH) spot trading volume reached $33.5 billion, down 5.9% from the previous day, a sign that traders are turning cautious as volatility cools.
Ethereum’s derivatives volume also dropped 10.37% to $72.55 billion, as per CoinGlass data, while open interest fell 3.66%. This decline suggests that leveraged traders are winding down their positions, probably taking profits or lowering exposure.
Spot ETH ETF outflows weigh on sentiment
According to SoSoValue data, Ethereum spot ETFs saw $145.68 million in net outflows on Oct. 20, marking the third consecutive day of withdrawals. BlackRock’s ETHA accounted for $117.8 million, followed by Fidelity’s FETH with $27.8 million. Other issuers remained largely unchanged.
Monthly outflows have now totaled $652 million, indicating institutional caution as well as a general shift in capital toward other safer assets like gold and Bitcoin (BTC). This change has dampened expectations for Ethereum’s long-awaited climb above $5,000, stalling momentum from its earlier “Uptober” rally.
Adding to the bearish tone, on-chain analyst Ali Martinez noted that Ethereum’s MVRV Momentum just flashed a “death cross” — a pattern that last preceded a drop from $3,300 to $1,400.
The MVRV Momentum metric tracks the speed at which unrealized profits or losses are changing across the network. When momentum goes negative, it indicates that holders are entering loss territory more quickly than fresh capital is coming in, which could indicate a sell-off or waning demand.
Ethereum price technical analysis
On the daily chart, ETH trades below the 20-day moving average at $4,177, indicating short-term weakness. The narrowing of the Bollinger Bands indicates low volatility before a potential breakout. The relative strength index, which is currently hovering around 41, suggests that bears are still in control but that the market is not yet oversold.
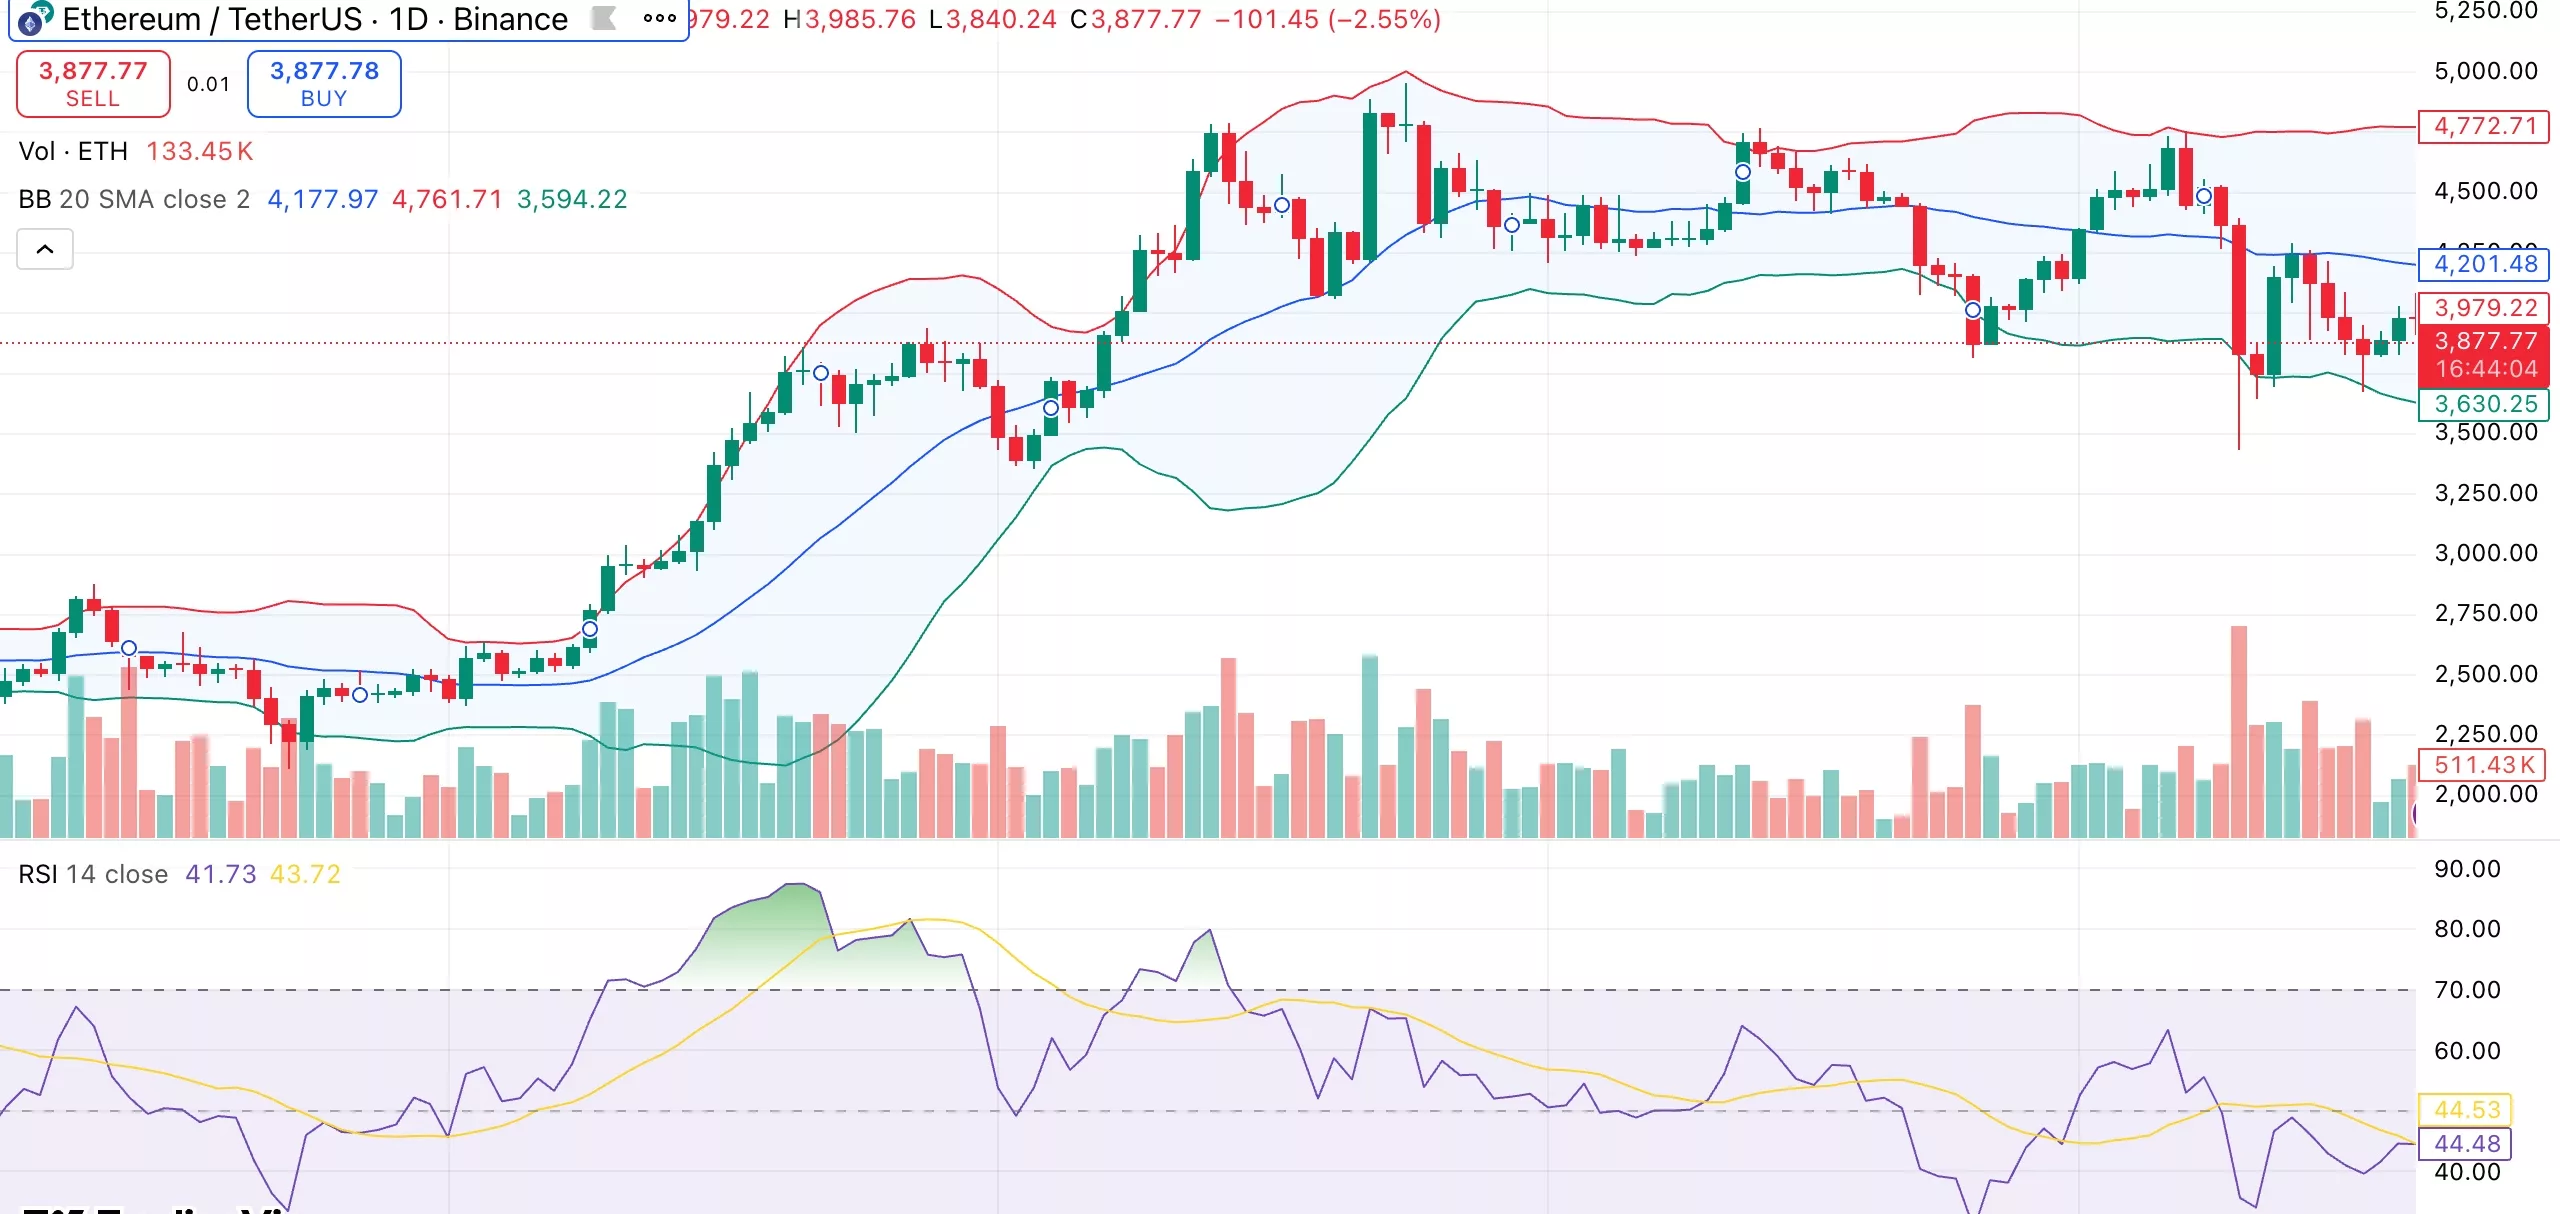
The $3,700 mark provides immediate support, and a stronger floor where prior rebounds have formed is located around $3,500. A close above the $4,200 resistance level could pave the way for a move toward $4,500.
ETH may test the lower band once more if outflows persist and MVRV conditions worsen. If ETF sentiment improves, stabilization close to the current range could draw dip-buying interest and provide a gradual recovery window.
Disclosure: This article does not represent investment advice. The content and materials featured on this page are for educational purposes only.