Ethereum price eyes $2,200 as local market structure flips bullish


Ethereum price has begun showing early signs of recovery as local market structure turns bullish. Consecutive higher highs and higher lows above key volume levels now place the $2,200 resistance zone in focus.
- Higher highs and higher lows signal bullish structure shift
- $1,862 high timeframe support held at value area low
- $2,200 major resistance becomes next upside target
Ethereum’s (ETH) recent price action suggests a shift in short-term momentum after a successful defense of major support. While the broader market remains range-bound, the internal structure has begun to show bullish characteristics.
This shift is raising the probability of a continued move higher toward the next significant resistance level.
Ethereum price key technical points
- Bullish Structure: Higher highs and higher lows forming above the Point of Control.
- Key Support Held: $1,862 acted as strong high timeframe demand.
- Upside Target: $2,200 high timeframe resistance above the value area high.
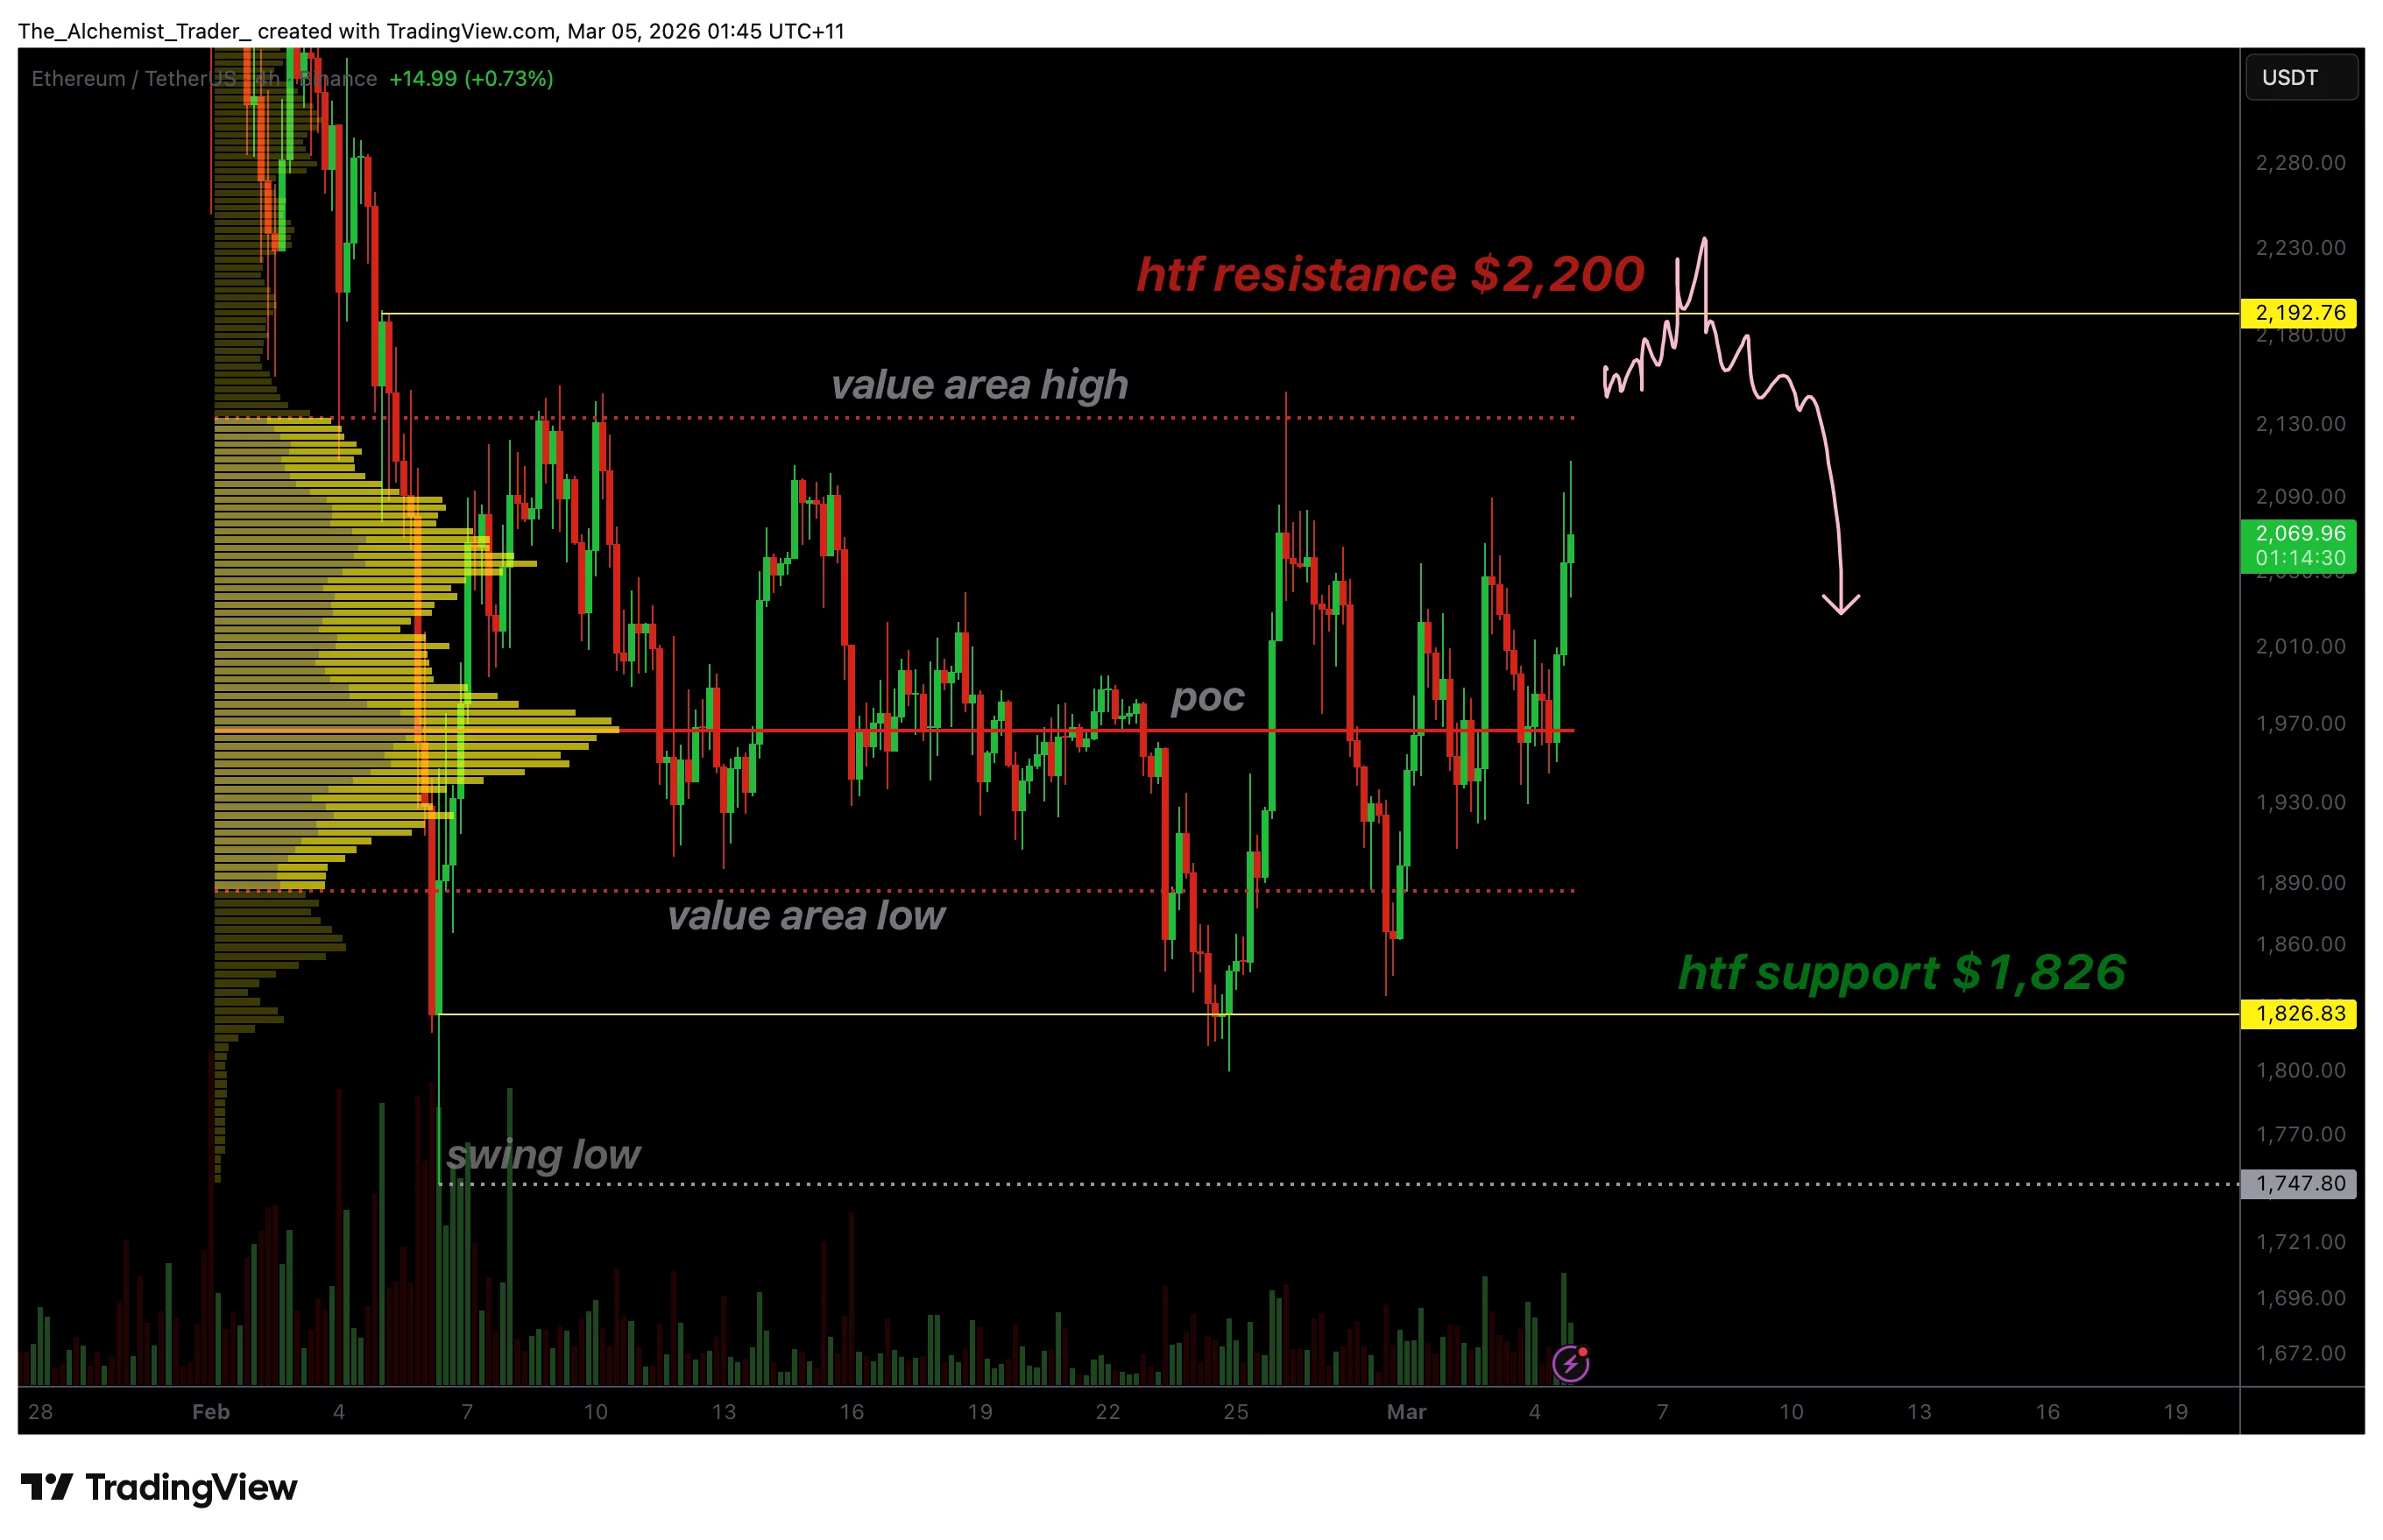
Ethereum’s current price action reflects an important local structural change. After previously trading in a corrective phase, the asset has begun forming consecutive higher highs and higher lows, a classic signal that momentum may be shifting in favor of buyers. This structural transition occurred as price reclaimed and held above the Point of Control (POC), which represents the area with the highest traded volume within the current trading range.
Holding above the POC typically signals that the market is establishing acceptance at higher prices. When buyers manage to sustain price above such an equilibrium level, it often opens the probability of a continuation move toward the upper boundary of the range.
A key factor supporting this shift was Ethereum’s reaction at the $1,862 high timeframe support level. This region aligns closely with the Value Area Low, a technical level where markets frequently find demand. The strong defense of this zone provided the catalyst for the initial bullish rotation that is now unfolding.
From a market structure perspective, this reaction marked the beginning of the internal trend shift. Buyers stepped in aggressively at support, absorbing selling pressure and pushing price back above key volume levels. The resulting momentum has allowed Ethereum to build a short-term bullish structure within the broader range environment.
Despite this positive development, it is important to note that Ethereum remains confined within a larger trading range on higher timeframes. Range-bound markets often produce multiple internal rotations between support and resistance before a decisive breakout occurs. As a result, short-term bullish expansions can still occur even while the broader structure remains neutral.
The next major technical level to watch is the $2,200 resistance zone, which sits above the current Value Area High. This area represents a significant supply region where sellers previously stepped in. If Ethereum continues to maintain its current bullish structure, price could attempt to test this level in the near term.
However, resistance zones such as $2,200 often attract selling pressure, particularly within range environments. Should price reach this area, the market may encounter renewed supply that could trigger a rotational move back toward support levels.
Volume dynamics will play a key role in determining the outcome. A strong expansion in bullish volume as price approaches resistance would increase the probability of a breakout attempt. Conversely, weakening participation could lead to rejection and continuation of the broader range-bound structure.
Overall, Ethereum’s internal market structure currently favors upside continuation, but the presence of strong overhead resistance means traders should remain cautious.
What to expect in the coming price action
If Ethereum maintains higher lows above the Point of Control, the probability of a rally toward the $2,200 resistance zone increases. However, failure to break and hold above this level could trigger another rotation within the broader range, sending price back toward high timeframe support near $1,862.