Bitcoin
Bitcoin (BTC)
$107,509.00 -2.59588
Bitcoin price
Ethereum
Ethereum (ETH)
$3,714.38 -3.60522
Ethereum price
BNB
BNB (BNB)
$1,018.62 -6.01858
BNB price
Solana
Solana (SOL)
$175.20 -5.04985
Solana price
XRP
XRP (XRP)
$2.42 -3.99185
XRP price
Shiba Inu
Shiba Inu (SHIB)
$0.0000096 -4.90137
Shiba Inu price
Pepe
Pepe (PEPE)
$0.0000061 -7.50438
Pepe price
Bonk
Bonk (BONK)
$0.0000129 -6.77723
Bonk price
dogwifhat
dogwifhat (WIF)
$0.486419 -8.38436
dogwifhat price
Popcat
Popcat (POPCAT)
$0.1344 -9.30967
Popcat price

Ethereum price forms 3 risky patterns, risking a 20% crash

Dorian Batycka
Edited by
Markets
Ethereum price forms 3 risky patterns, risking a 20% crash

Ethereum price remains in a bear market, and three risky chart patterns suggest that it may experience a 20% crash soon.

Ethereum (ETH), the second-biggest coin in crypto, retreated to $2,670 on Monday, down by over 35% from its highest level in December.

Its performance happened as it faced substantial competition in the blockchain industry. Most of this competition is coming from popular layer-1 networks like Berachain (BERA), Solana (SOL), and BNB Smart Chain (BNB). 

Ethereum is also losing market share to layer-2 blockchains like Base and Arbitrum, that have become popular because of their lower costs. For example, DEX protocols on Ethereum handled volume worth $81 billion in the last 30 days, while Base (BASE) and Arbitrum (ARB) processed $35 billion and $28 billion, respectively.

Third-party data shows that Ethereum ETFs are not attracting as much inflows as was expected. They experienced outflows in the last two market days, that have brought the cumulative total to $3.15 billion. In contrast, Bitcoin ETFs have accumulated almost $40 billion in inflows.

Ethereum’s daily trading volume has also continued falling, moving to $126 billion, down from the December high of $330 billion. Its revenue has also continued falling, moving to $5 million on Sunday, lower than over $58 million in November last year. 

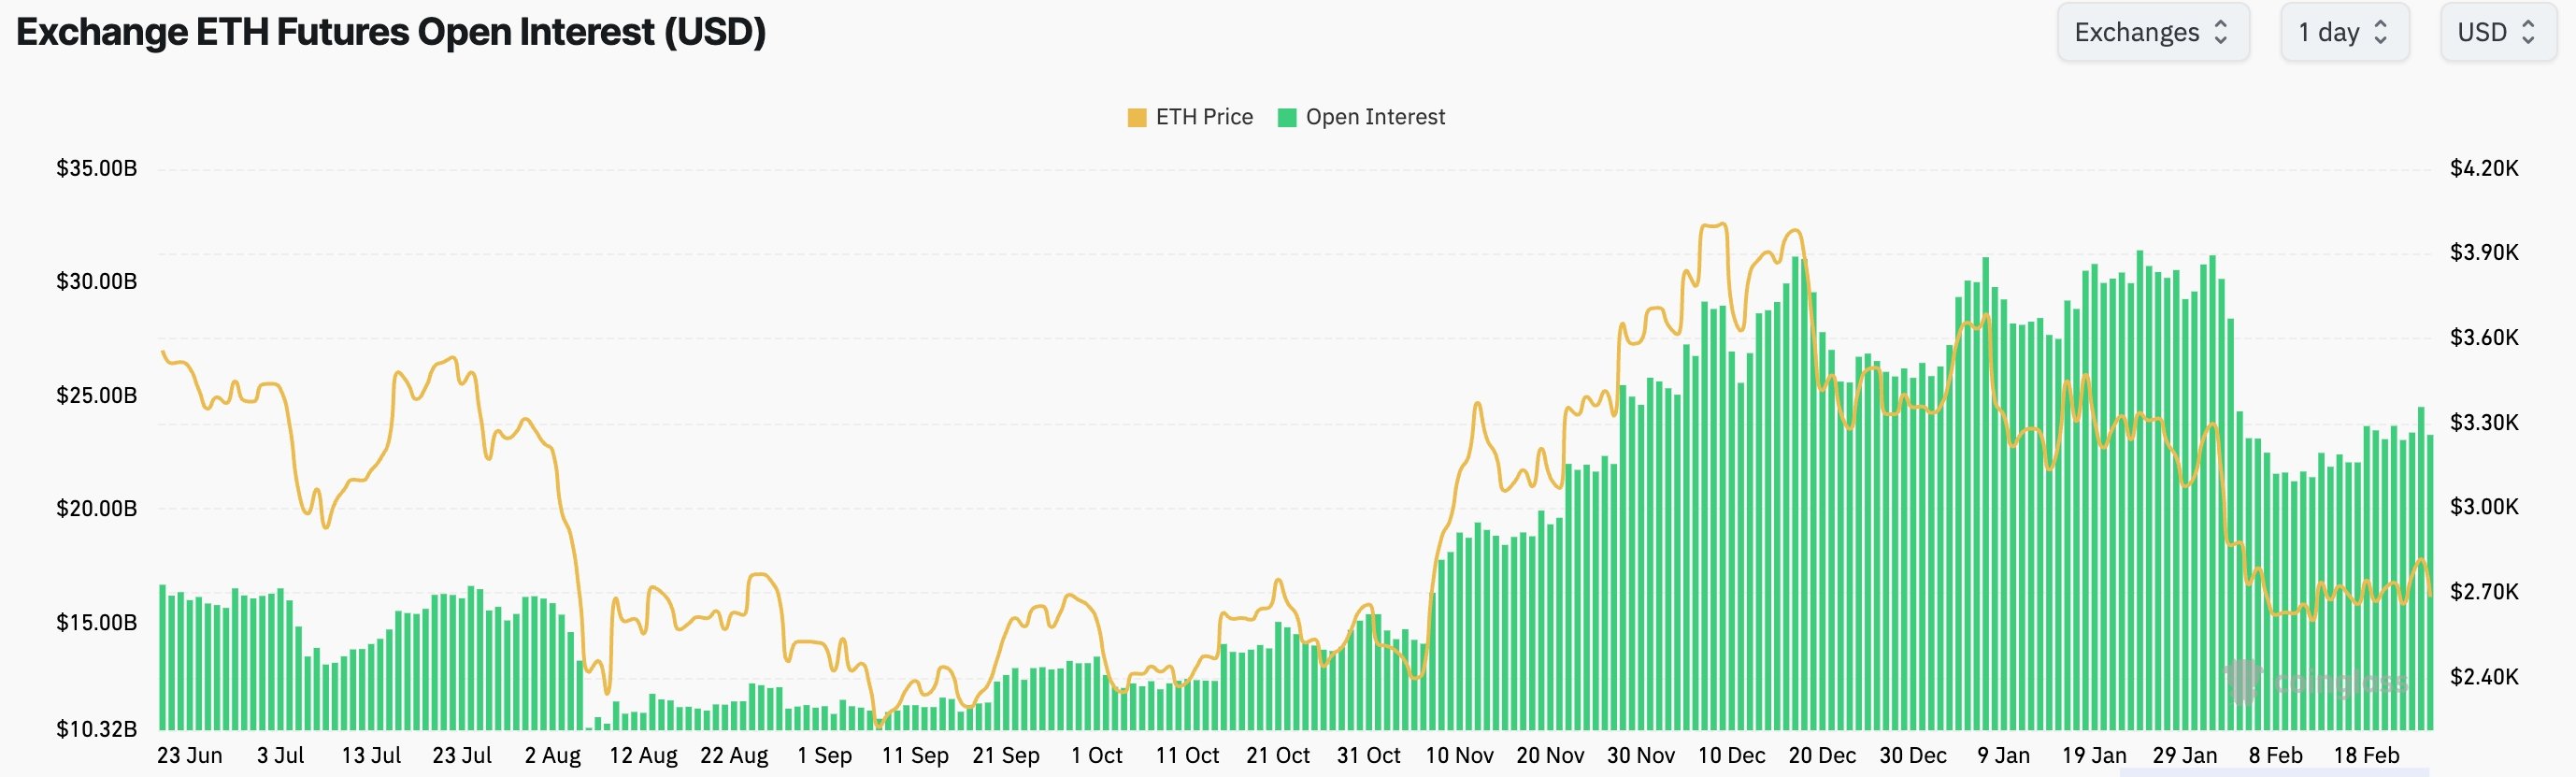
Further, Ethereum’s futures open interest has crashed from its 2024 highs. It has an interest of $23.3 billion, down from this month’s high of $35 billion.

Ethereum open interest
ETH open interest | Source: CoinGlass

Ethereum price patterns point to more downside

Ethereum price forms 3 risky patterns, risking a 20% crash - 1
Ethereum price chart | Source: crypto.news

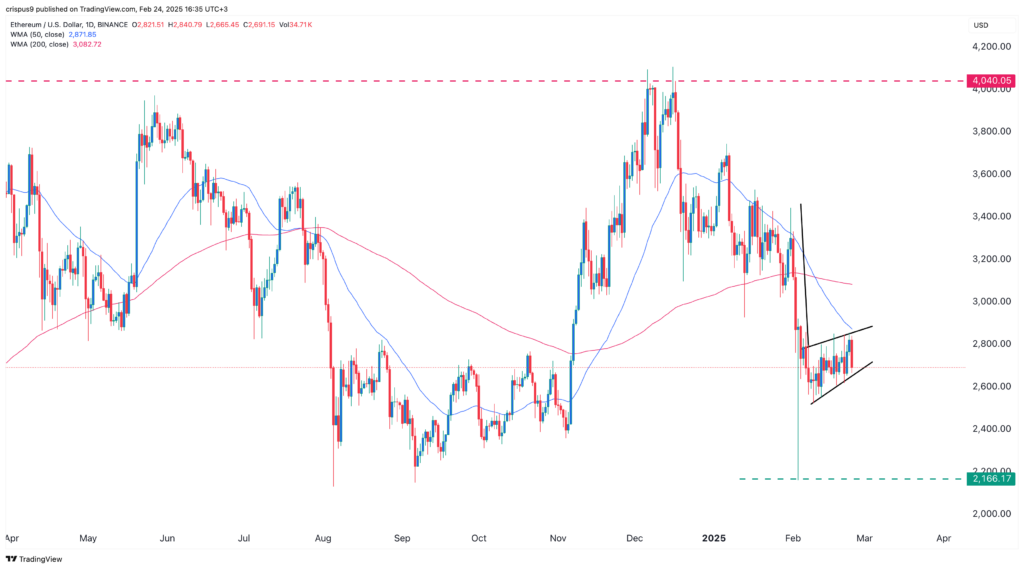
The daily chart shows that the Ethereum value may be at risk of more downside. It formed a death cross on February 9 as the 50-day and 200-day Weighted Moving Averages crossed each other.

The coin has also formed a rising wedge pattern, which happens when there are two ascending converging trendlines. It has also formed a bearish pennant pattern, comprising a long vertical line and a triangle. 

In most cases, these patterns usually lead to more downside, with the next level to watch being at $2,166, its lowest level this month. A break below that level will point to more downside, potentially to $2,000.