Ethereum price forms giant hammer as key metric nears $1 trillion


Ethereum price has formed a giant hammer candlestick pattern on the weekly chart, pointing to a major comeback as exchange-traded fund inflows rose and its adjusted stablecoin volume jumped to nearly $1 trillion.
- Ethereum price has formed a hammer candlestick pattern on the weekly chart.
- The adjusted monthly stablecoin volume rose to almost $1 trillion.
- Spot Ethereum ETF inflows have continued this week.
Ethereum boosted by stablecoin growth and ETF inflows
Ethereum (ETH) was trading at $4,450 on Thursday, up by over 15% from its lowest level last week. Its 24-hour volume rose to $46 billion, while the futures open interest soared to nearly $60 billion.
The ongoing ETH price jump coincided with the ongoing crypto market rally as traders cheer the rising odds of a Federal Reserve interest rate cut and the upcoming crypto ETF approval season.
Ethereum price also jumped because of the ongoing demand from American investors. Data compiled by SoSoValue shows that the spot Ethereum ETFs added over $80 million in assets on Wednesday, bringing the weekly inflows to over $755 million. This week’s inflows are a sharp reversal after it shed $795 million last week.
More data shows that Ethereum is benefiting from the ongoing demand stablecoins. Artemis data shows that the stablecoin supply in the network jumped by 5.8% in the last 30 days to $162 billion.
More data shows that the adjusted transaction volume rose by 15% to $901 billion, meaning that it may cross $1 trillion soon. These are huge numbers considering that PayPal had a total payment volume of $408 million in the last 30 days.
Other parts of the Ethereum network are doing well, with the total value locked in its decentralized finance network soaring to a record high of over $200 billion recently.
Ethereum price technical analysis as a hammer forms
The weekly timeframe chart shows that the Ethereum price bottomed at $3,828 last week as the crypto market crashed. It formed a hammer candlestick, which is characterized by a body and a long lower shadow, and is one of the most common bullish reversal candlestick patterns.
Ethereum also retested the important support level at $4,100, its highest level in March and December last year. A break and retest normally confirms the continuation pattern.
The coin also remains above the 50-week and 100-week Exponential Moving Averages (EMA), a sign that bulls remain in control.
Therefore, the coin will likely continue rising as bulls target the year-to-date high of $4,955. A move above that target will point to more gains towards $5,000 and above.
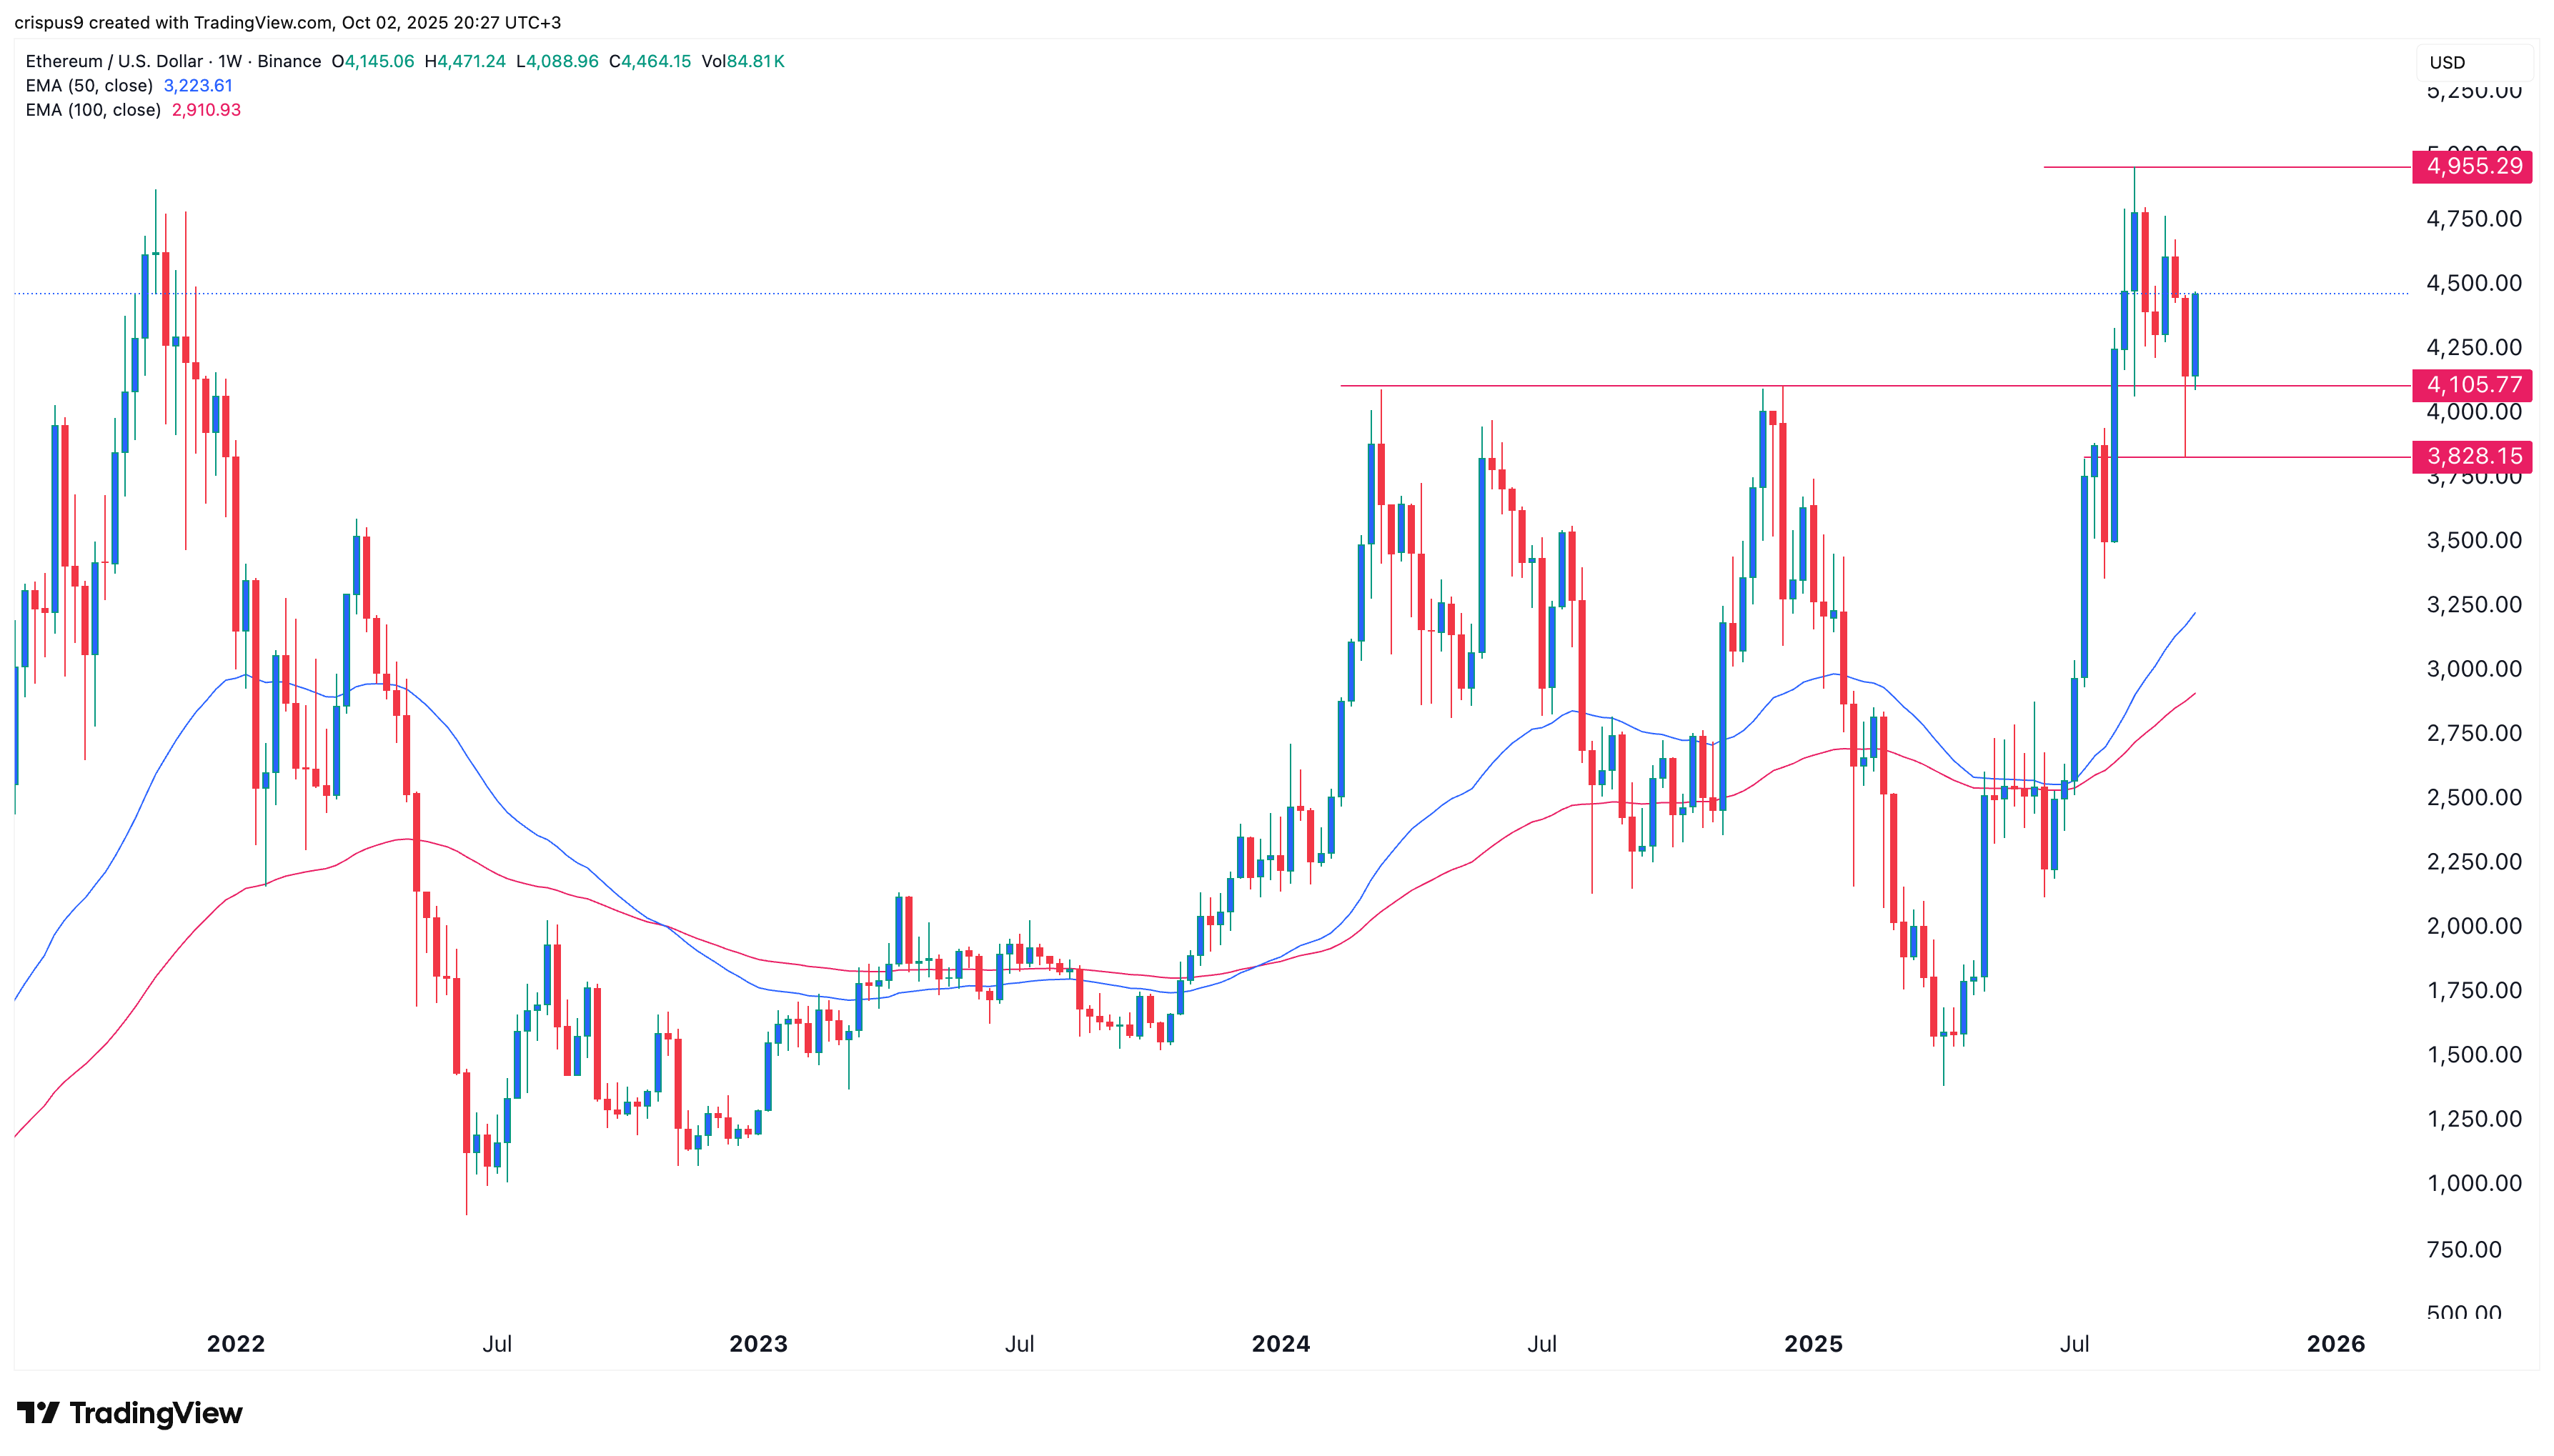
The bullish Ethereum price forecast will become invalid if the coin drops below the key support at $3,828. Such a move would point to more downside, potentially to $3,500.
Disclosure: This article does not represent investment advice. The content and materials featured on this page are for educational purposes only.