Ethereum price outlook as it charts a bearish crossover while exchange reserves fall to 2016 lows


Ethereum price fell 13% over the past week, charting a bearish crossover that hints at more downside ahead. At the same time, exchange reserves have fallen to 10-year lows.
- Ethereum price has fallen nearly 46% from its yearly high.
- Bearish chart structures, including a descending channel and a multi-year head and shoulders pattern, continue to cap upside.
According to data from crypto.news, Ethereum (ETH) price fell nearly 46% to around $1,800 on Feb. 6 from its highest point this year. This came as the broader crypto market lost over a trillion in value, with multiple macroeconomic and geopolitical concerns impacting the risk appetite of investors.
While it has since recovered a small portion of its losses, trading sideways between $2,000 and $2,100 over the past couple of days, it has so far lacked any strong momentum to reclaim its yearly highs.
Ethereum price remained in a downtrend after it fell below multiple key support lines, which in turn triggered a liquidation cascade as highly leveraged bullish bets were wiped out.
Furthermore, institutional appetite via spot Ethereum ETFs has also fallen flat over the past few months, which has also eroded hopes of an immediate recovery. These investment vehicles had been one of the major contributors that helped push Ethereum price to an all-time high during October last year.
The leading altcoin’s weakness also came from the technical setup forming on the charts. The daily chart shows that Ethereum price has respected the boundaries of a descending parallel channel pattern, which gained more validity since its downtrend that began in October last year.
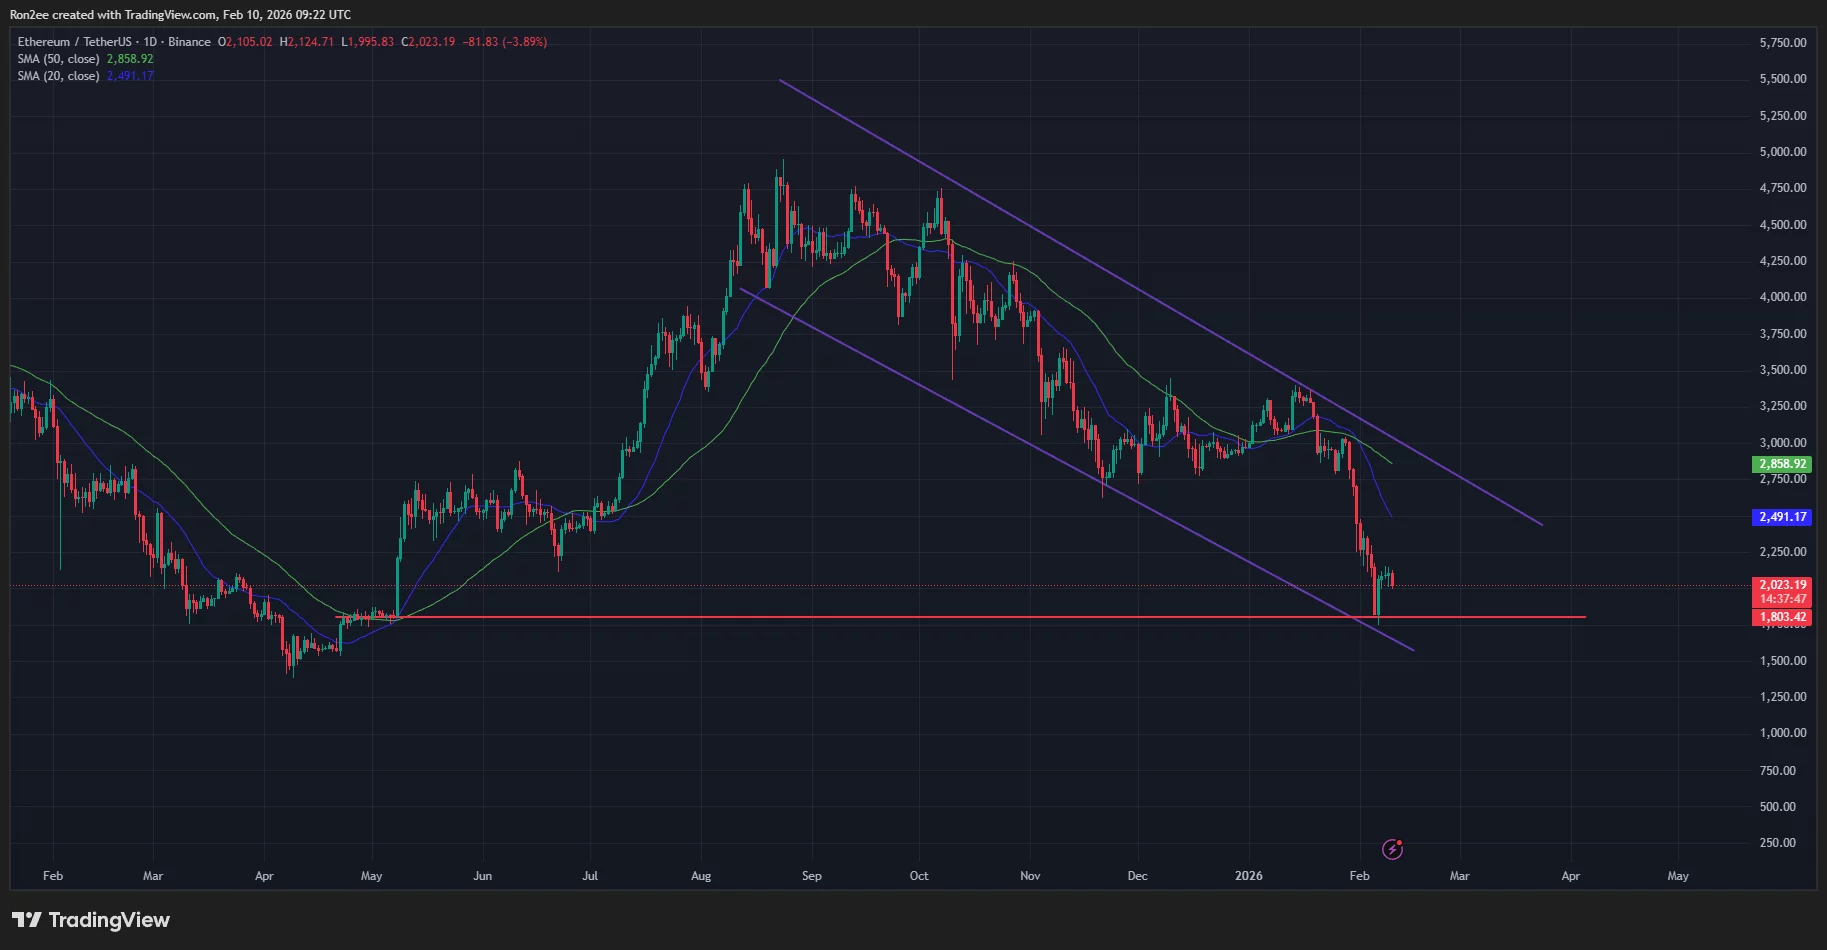
Such a pattern is one of the most bearish formations in technical analysis and typically hints at more downside for a token as long as it remains confined within the upper resistance line.
For Ethereum, the bearish outlook gains more weight in the short term with the 20-day SMA forming a bearish crossover with the 50-day one.
On the weekly chart, Ethereum price has also confirmed a multi-year head and shoulders pattern, another bearish formation that has historically been a precursor to more downside over a much longer term.
As such, if Ethereum fails to hold the $2,000 psychological support level, which has become a key battleground to decide the fate of investor sentiment, it could lead to a retracement towards $1,800, the lowest point so far this year.
Ethereum price downturn comes as exchange balances fall to 2016 lows
Despite the bearish forecast, an on-chain metric seems to be in contradiction to the grim technical price action. Notably, the reserve of ETH tokens held on exchanges has fallen to roughly 16 million ETH, levels last recorded around mid 2016, data from CryptoQuant shows.
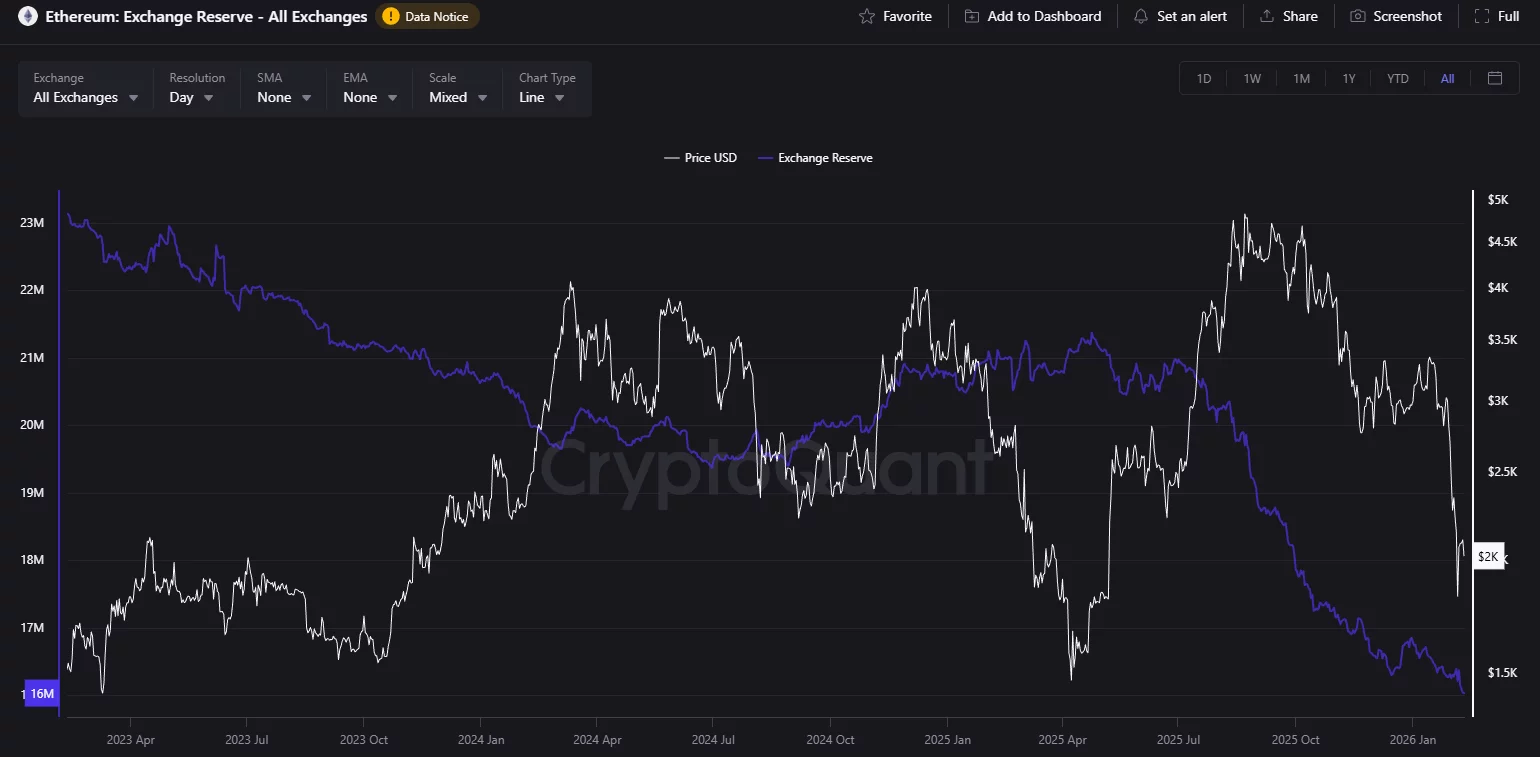
While a drop in balances held in exchanges typically tends to support price gains, if the liquidity on exchanges continues to thin while large players unwind, price action could become increasingly volatile.
As crypto.news reported, Tom Lee-backed Bitmine added a massive 40,000 ETH worth $83.4 million over the past day, taking a big step closer towards its goal of acquiring 5% of the total circulating supply.
Disclosure: This article does not represent investment advice. The content and materials featured on this page are for educational purposes only.