Ethereum price signals rally as ETF winning streak continues


The current Ethereum price formed a bullish flag and a golden cross pattern, indicating an eventual comeback as ETF inflows jump.
Ethereum (ETH) was trading at $2,530 at last check on Saturday, inside the narrow range where it has remained since May 10. This price is about 85% above its lowest level in April this year.
Data shows that American investors are aggressively accumulating Ethereum. SoSoValue numbers show that spot Ethereum ETFs have had inflows in the past five consecutive weeks.
These funds added $528 million in inflows this week, a big increase from last week’s $281 million. This increase brings the cumulative net inflow to $3.85 billion and the total amount held by these funds to over $10 billion.
BlackRock’s ETHA ETF has had $5.23 billion in inflows and now holds $4.1 billion in assets. Grayscale’s ETHE and ETH ETFs hold $2.8 billion and $1.3 billion in assets, while Fidelity’s $1.3 billion in inflows.
A likely reason for the ETH accumulation is that it became undervalued as its price plunged in April. The closely-watched market value to realized value or MVRV dropped to minus 0.86 on April 9.
A falling MVRV indicator signals that an asset is highly undervalued because it compares the current market cap and the realized value, which is the price at which each coin was last moved and aggregated across supply.
Ethereum also maintains a big market share in key crypto industries. It has a total value locked of $134 billion and a market dominance of 62%. It also has a stablecoin dominance of 50%, with its total holdings rising to $125 billion.
Ethereum price technical analysis
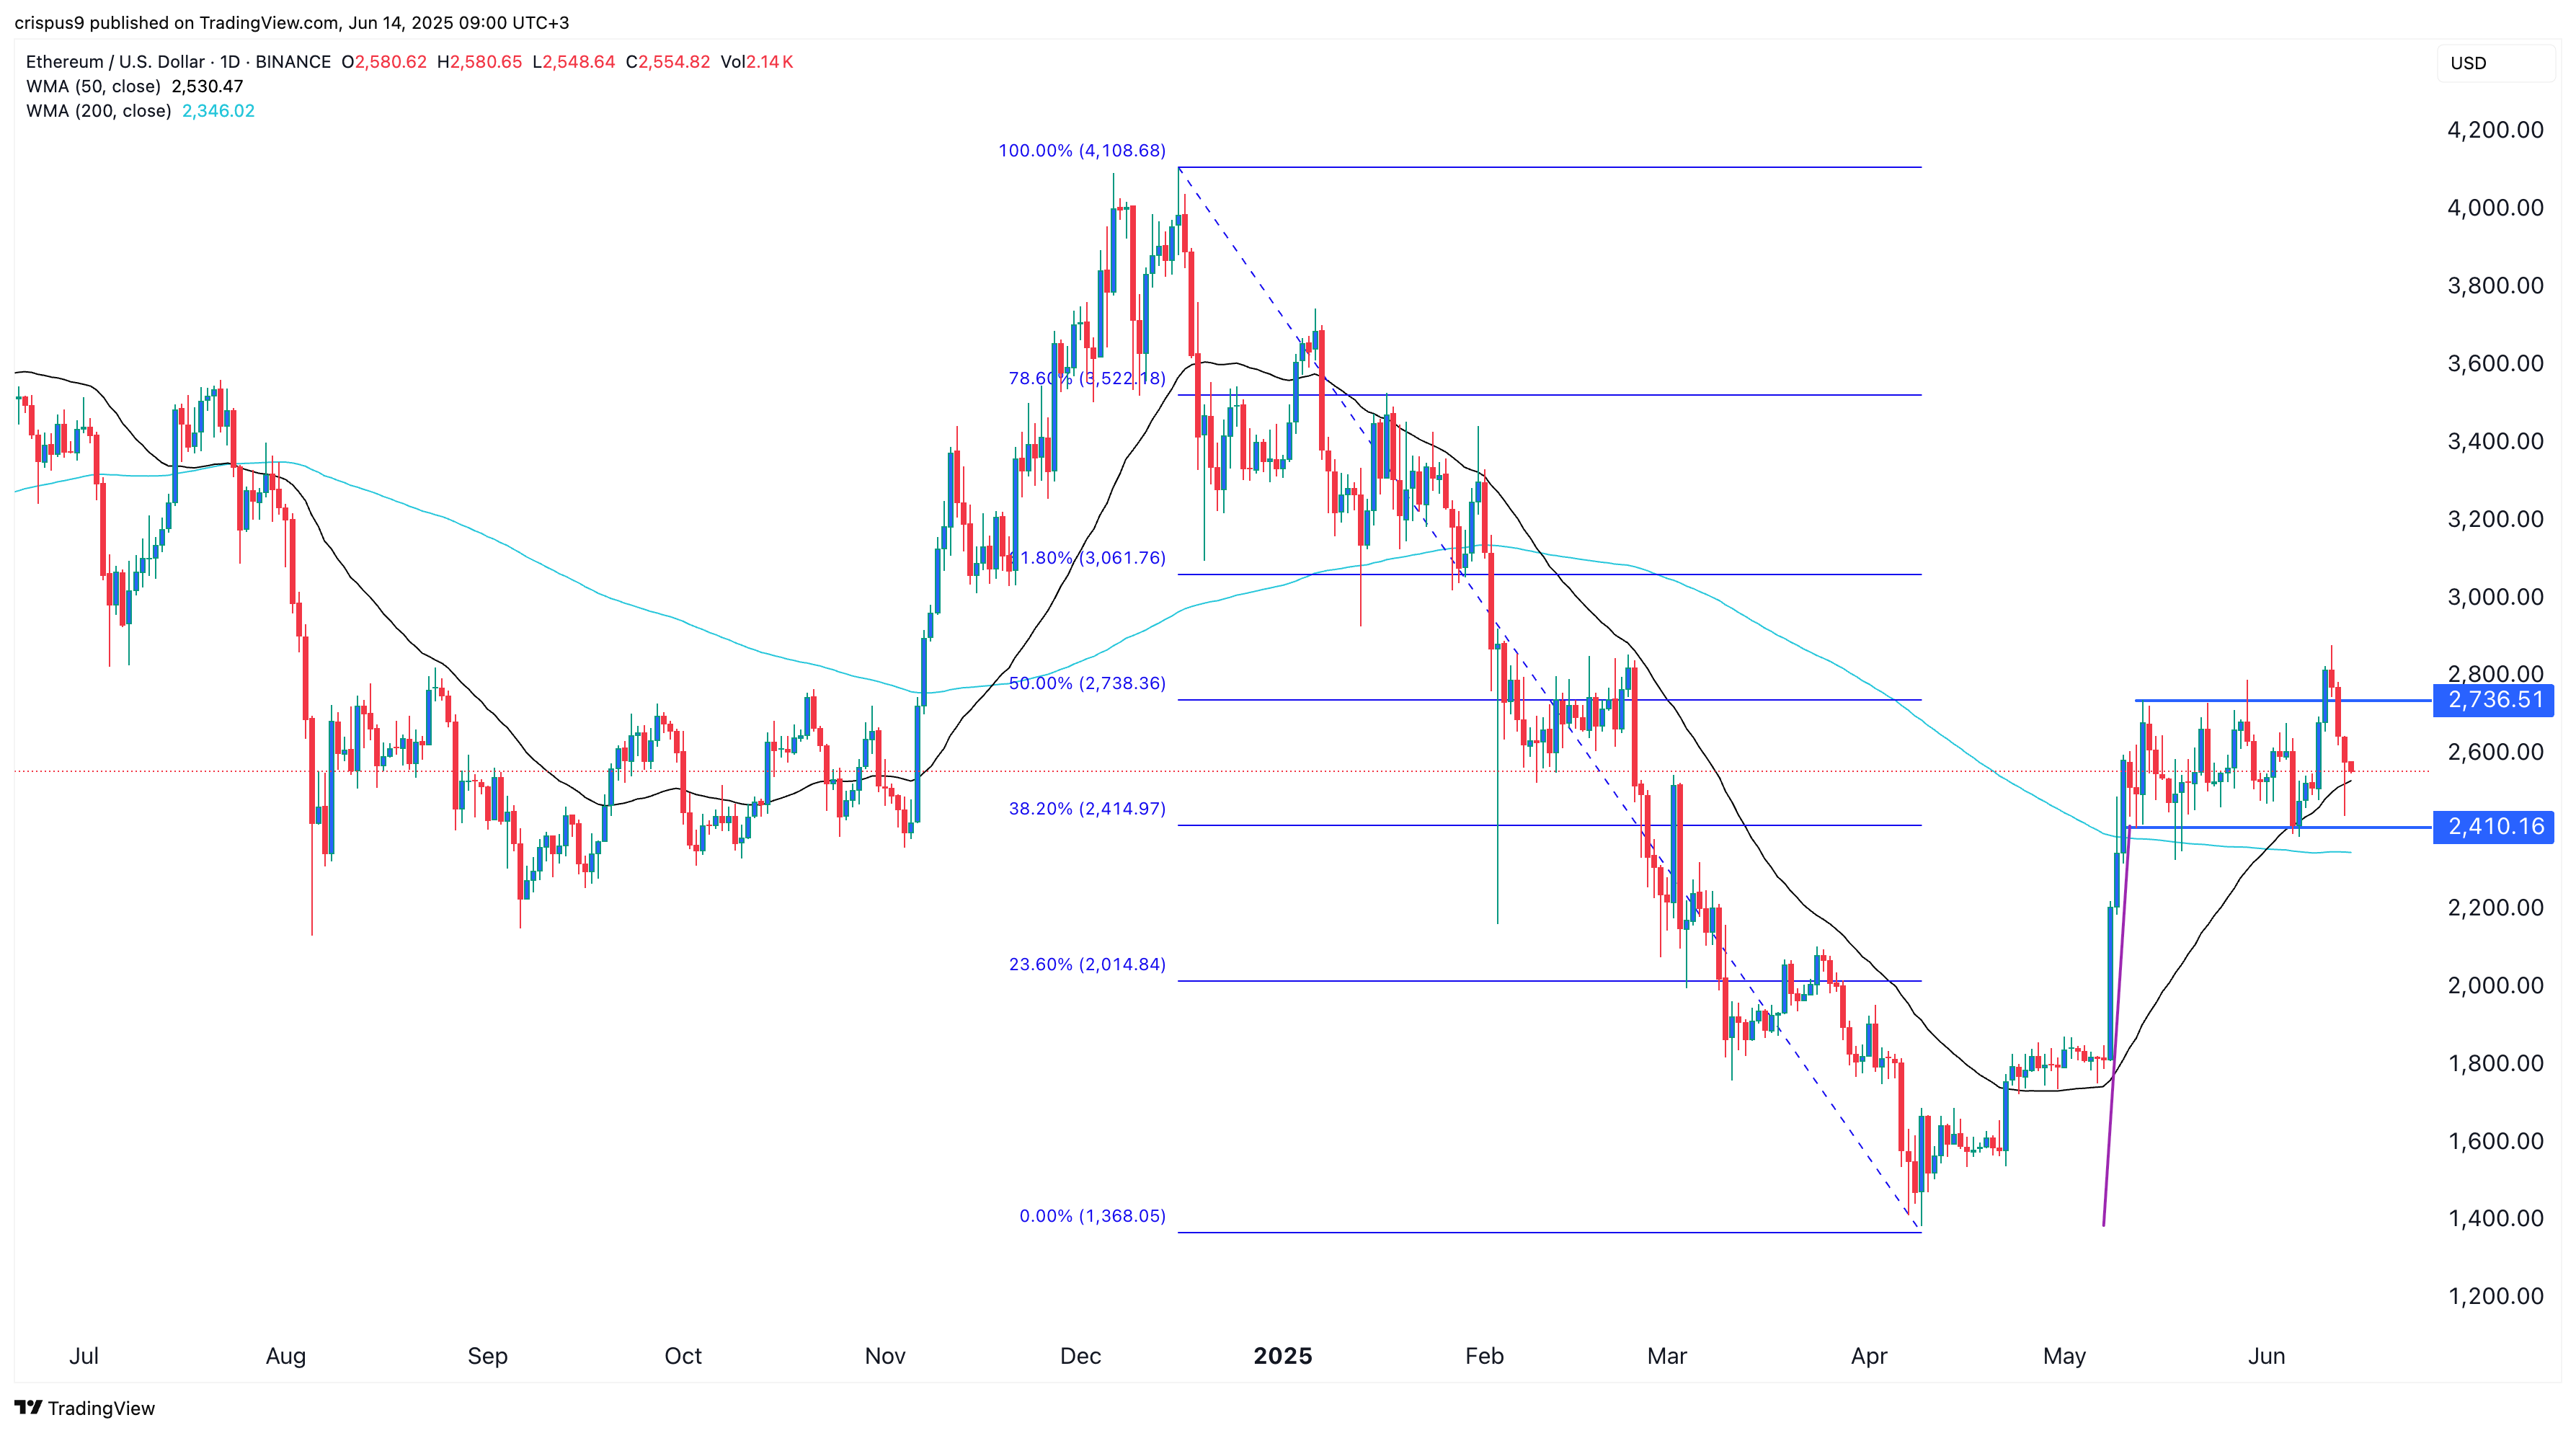
The daily chart shows that Ethereum price has formed a bullish flag pattern. This pattern comprises a vertical line, which represents the flag pole. It also has a flag, which can be a horizontal or a descending channel. It is now in the flag section.
ETH price has formed a golden cross pattern as the 50-day and 200-day Weighted Moving Averages crossed each other. Therefore, the most likely scenario is where it bounces back, and possibly retests the psychological point at $3,000. A move above $3,000 will boost the possibility of it soaring to $4,000 eventually.