Ethereum price stays flat despite $170m ETF inflows


Institutional demand for Ethereum continues to build quietly, even as the asset’s price shows signs of fatigue.
- Ethereum ETFs posted $170M in net inflows on Oct. 15, led by BlackRock’s ETHA despite ETH’s flat trading near $4,054.
- Technical indicators remain neutral, with RSI at 44.57, suggesting Ethereum may continue consolidating until a new catalyst emerges.
- Key resistance levels at $4,292 and $4,452 could trigger an upside breakout, while support near $3,938 and $3,744 defines the short-term downside risk.
Ethereum is trading around $4,054, down nearly 2% on the day, with a narrow range between $4,078 and $3,940. The muted price movement reflects a sharp drop in trading activity, with 24-hour volume down over 25%, per CoinMarketCap data.
Despite the lack of momentum, institutional inflows into spot Ethereum ETFs remain strong. The U.S.-listed funds recorded $170 million in net inflows on Oct. 15, following $236 million the previous day, according to data from SoSoValue.
BlackRock’s ETHA led the charge with $164.3 million, while Bitwise and Fidelity also reported steady positive flows. This consistent accumulation, even as ETH (ETH) prices stagnate, points to strong institutional conviction in Ethereum’s long-term value.
The contrast between flat price action and continued ETF inflows suggests that large investors are quietly building exposure, potentially positioning ahead of a broader market shift. Such periods of low volatility as currently seen, often precede sharp directional moves once trading volume and risk appetite return.
ETH price outlook as Ethereum ETFs hold strong
While Ethereum’s price remains range-bound, technical indicators point to a market in consolidation, potentially gearing up for a decisive move. On the daily chart, ETH is currently trading below its 9-day simple moving average (SMA) at $4,114, reinforcing the short-term bearish bias.
Despite Monday’s modest intraday bounce, the broader trend remains muted, with lower highs forming since the early October peak near $4,400.
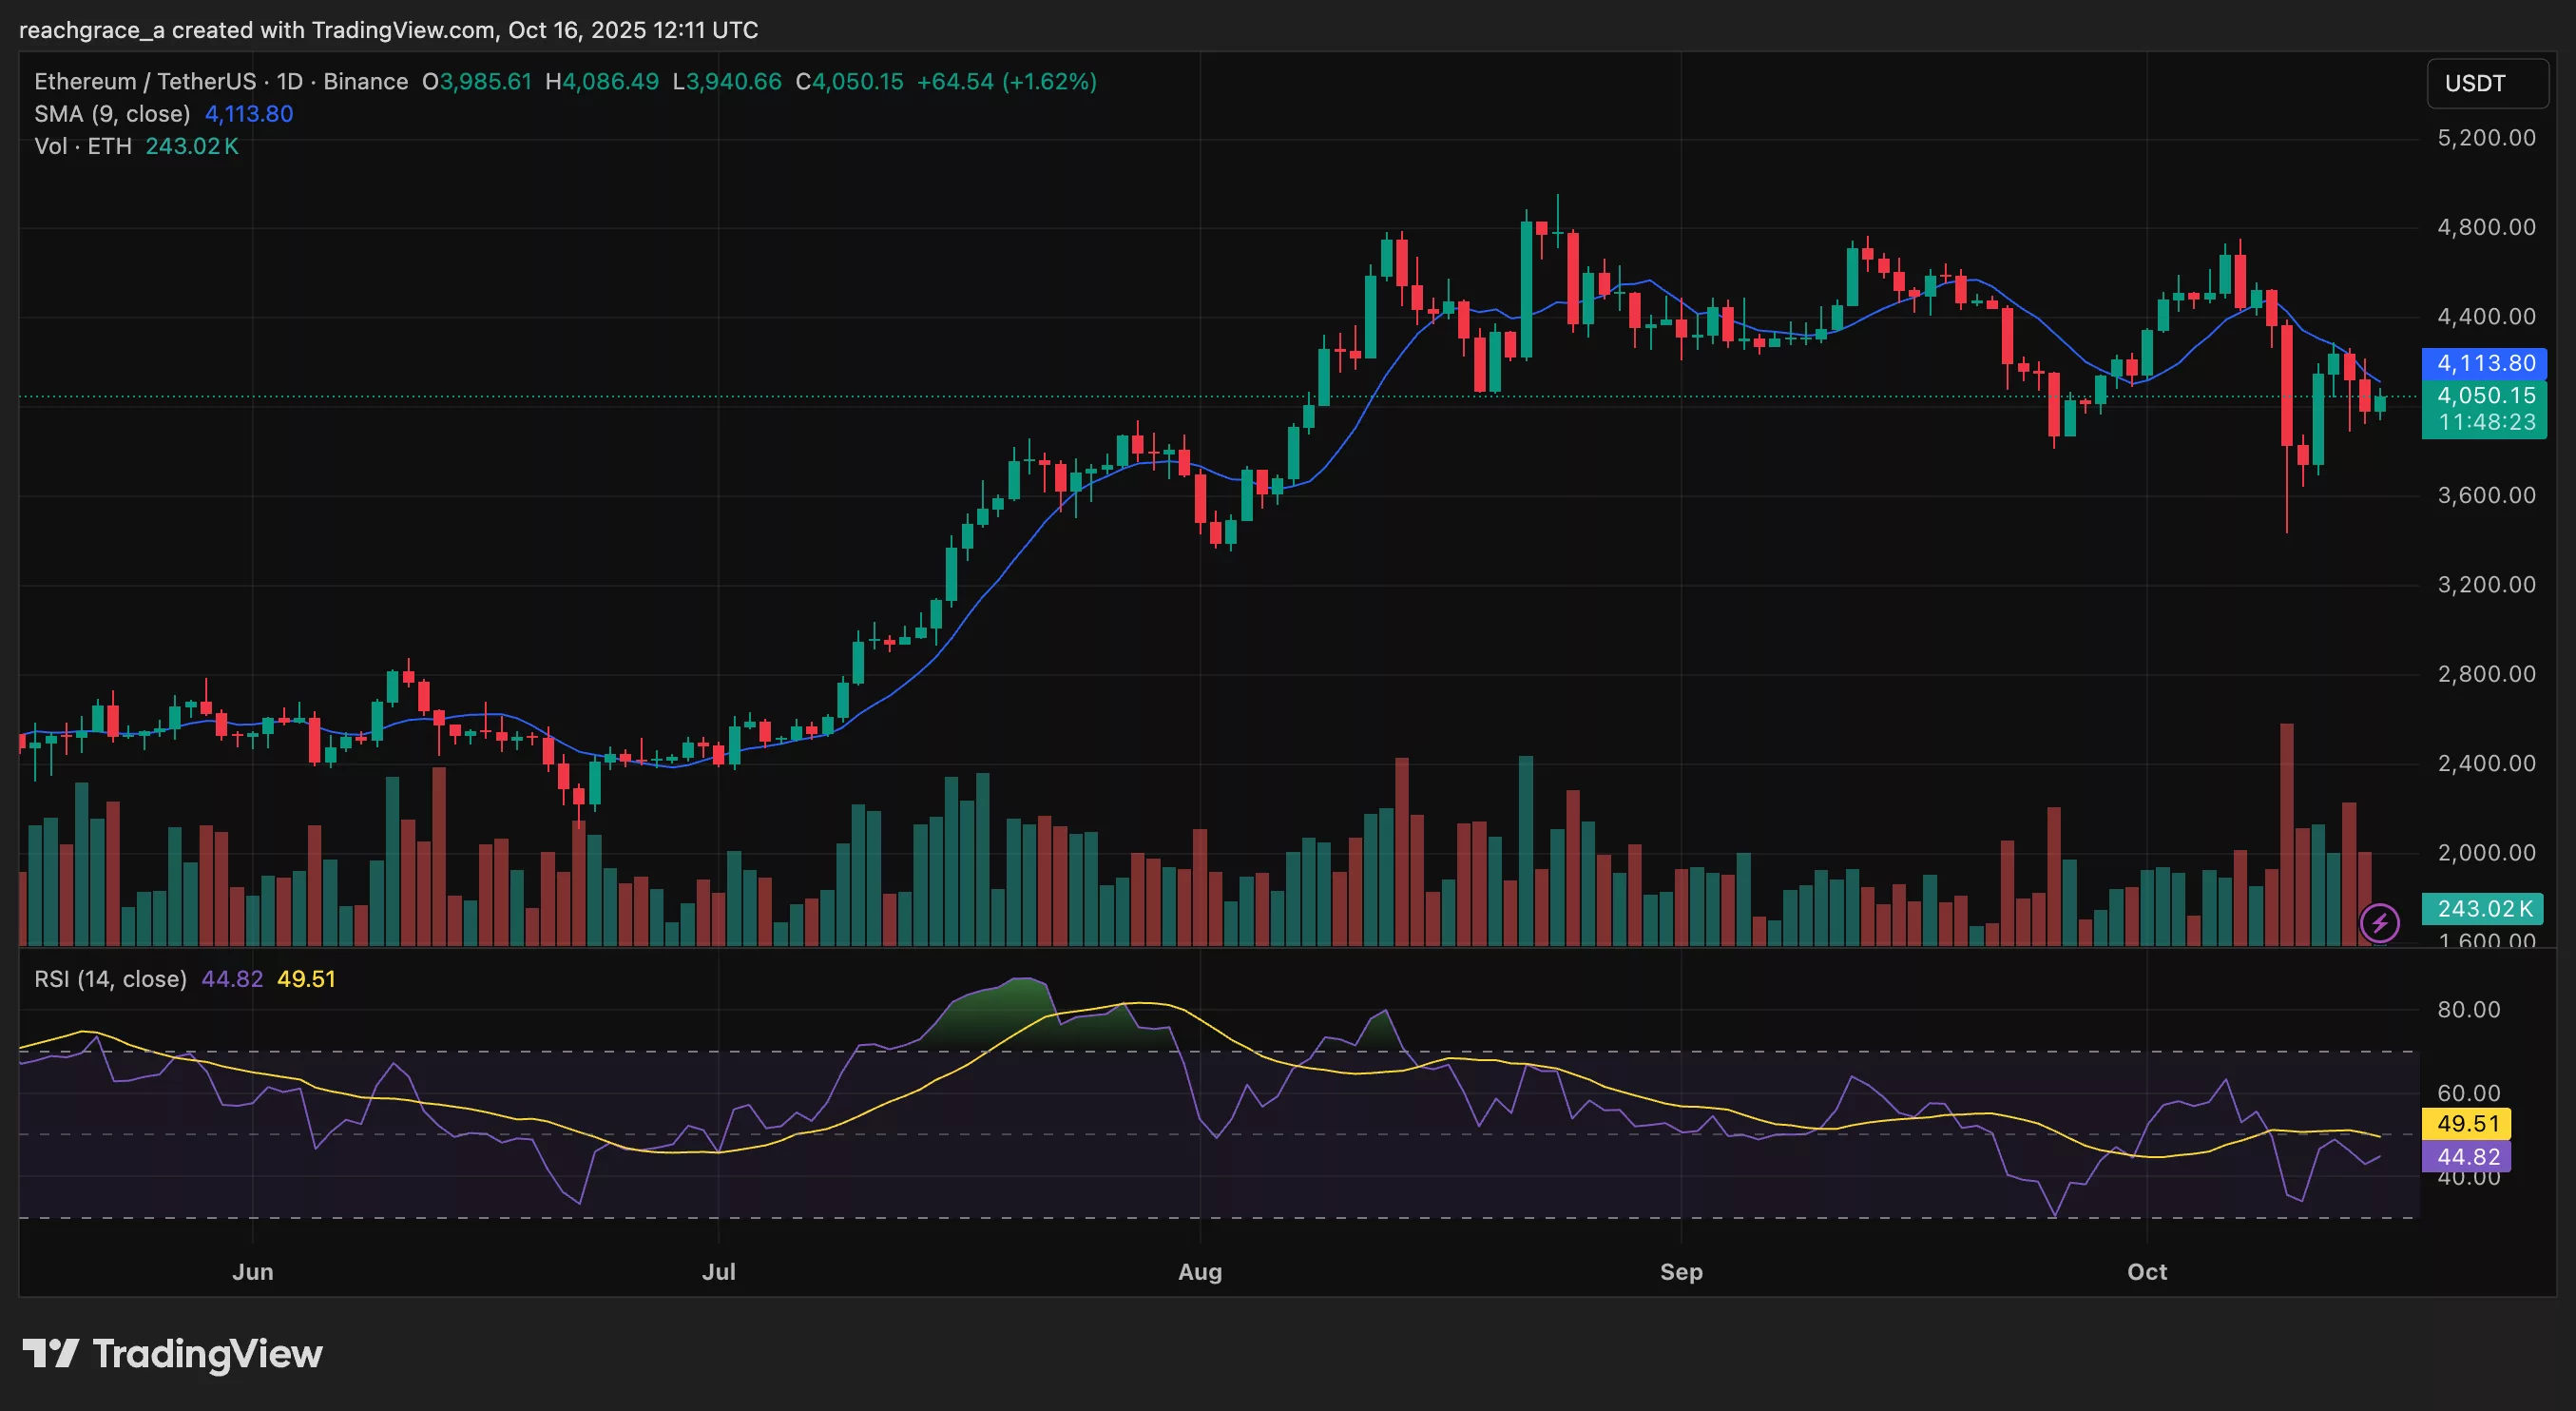
Relative Strength Index (RSI) currently sits at 44.57, hovering below the neutral 50 mark, which signals weak momentum and subdued demand. If buying pressure picks up and institutional flows from ETFs continue, a bullish breakout is possible.
Key resistance levels sit at $4,292 and $4,452. A move above these zones could trigger a rally toward $4,500 and possibly retest yearly highs near $4,956, provided trading volumes expand.
In the bearish scenario, weakening technicals could signal fading support, risking a dip toward $3,938 and $3,744, with deeper pullbacks potentially extending to $3,583 if negative sentiment returns across the broader market.