Ethereum’s short-term outlook weakens amid rising exchange inflows and falling open interest


Ethereum’s recent rally may be losing momentum as exchange inflows rise and derivatives data point to softening market support.
Nearly 100,000 ETH, or about $250 million, were deposited into Binance in two sizable waves, as per a July 1 analysis by CryptoQuant contributor Amr Taha. These deposits, which usually indicate larger exchange reserves, may result in selling pressure if market sentiment shifts.
Taha also observed that the gap between Ethereum spot price and the open interest on Binance was growing. Since June 26, ETH has shown steady buying in the spot market, reaching three consecutive local highs above $2,500.
However, Binance Open Interest has lagged, hitting a series of lower highs below $5.6 billion. This suggests that fewer traders are opening new positions, which could be a sign of caution or uncertainty about the strength of the move.
The continuous reduction in U.S. Federal Reserve net liquidity is another factor that might add to the uncertainty. Liquidity has decreased from about $6.2 trillion to $5.84 trillion in recent weeks.
Lower liquidity tends to limit risk-taking by reducing access to capital in both traditional and crypto markets. Unless Ethereum sees high demand from buyers ready to absorb this environment, its upside might be limited in the short-term.
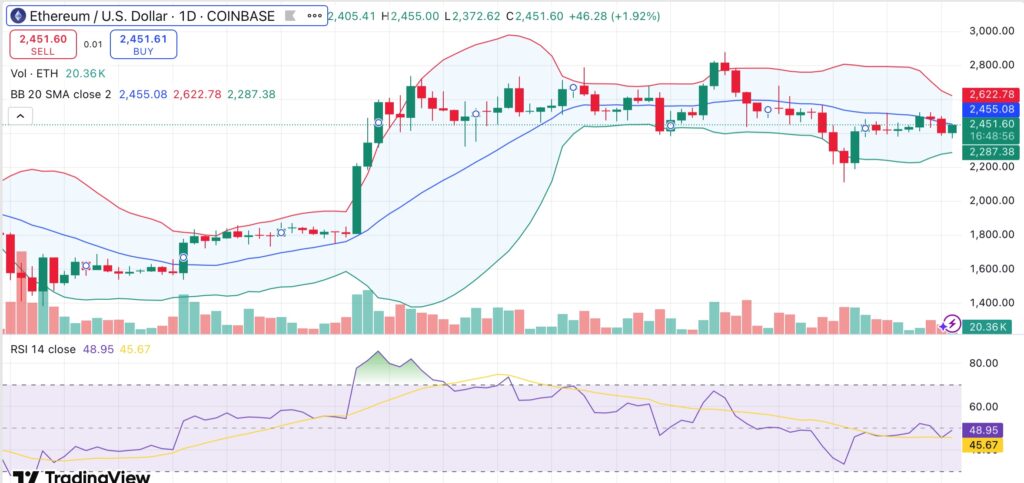
Ethereum is trading at $2,451 at press time, down 0.5% over the last day. The price is approaching $2,455, which has acted as resistance over the previous week and marks the 20-day simple moving average.
Technical indicators, such as the tightening Bollinger Bands and the relative strength index at 48.9, indicate that the market is in a consolidation phase with little volatility and no clear directional bias.
Although oscillators like the Stochastic RSI are approaching overbought territory, which limits the potential for short-term upside, momentum and MACD indicators display mild bullish signals.
Longer-term averages are still above the current price, suggesting broader weakness. Short-term moving averages, such as the 10-day and 50-day exponential averages, are offering little support.
The next upward target might be the upper Bollinger Band around $2,622 if buying pressure returns and Ethereum breaks above $2,500 with increased volume and rising open interest. If current support gives way and exchange inflows keep outpacing demand, the price might retest the lower band around $2,287, increasing the risk of a deeper pullback.