Fresh All-Time High Due Again for ETH-USD?
ETH-USD has experienced heightened volatility after posting a fresh all-time high above at $15.1799, bouncing between $15.00 and $10.00 over the past few days. The chart below shows the short-term outlook; buyers are in control since the price is above the Ichimoku cloud but their dominance seems to be weakening; the market has moved below the support previously provided by the conversion line around $13.41 earlier today. ETH-USD is currently down 1.14% on today’s open on the Kraken exchange but on the daily timeframe the immediate trend is upward with a higher high posted today. This suggests we should look for long-term buying opportunities.
The psychological $10.00 level, indicated by the horizontal green line on the chart below, has held as strong support after being tested over the weekend and early this week; it serves as a good place to enter into long positions if the market moves to re-test this level. The price action is currently sitting just above $13.00 and the conversion (blue) line looks to be moving below the base (dark-red) line which will give a bearish signal. This would precipitate a move below the cloud with a tendency towards fractal support at $12.00 and $10.00, providing good buying opportunities or a short-term selling opportunities once the conversion line moves below the base line.
The Ichimoku cloud is very thin over the next 8 hours or so suggesting only very weak support around this area. Also, the base line and conversion line are both acting as minor resistance at $13.005 and $13.203 respectively. If there is an hourly close above this level then this would provide a bullish outlook. Once either of these signals are given, long positions in ETH-USD would be recommended and the market would be looking to test fractal resistances at $13.6061 and $13.75. Otherwise, a test of $12.00 looks to be the next move for the market.
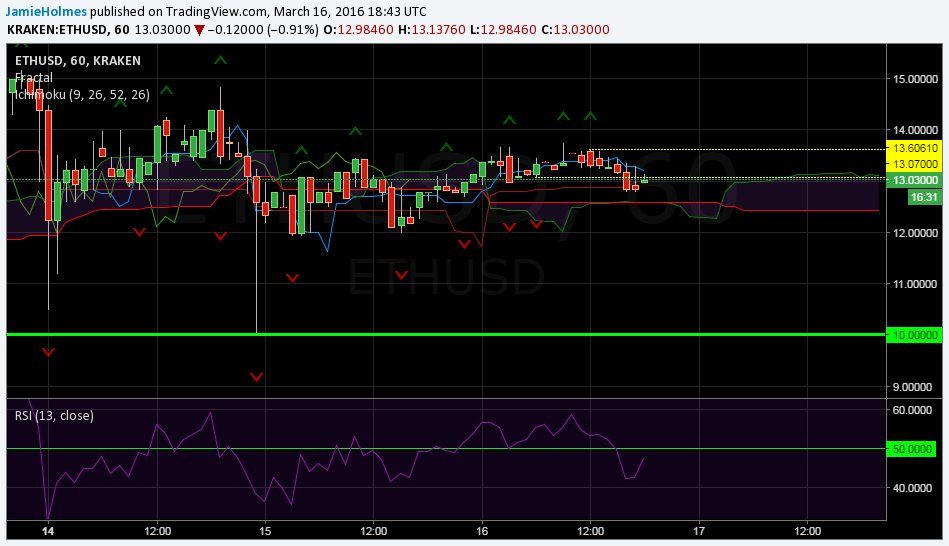
A close above $13.6061 for an hourly trading session would provide indication of bullish dominance and would see the market tends towards the all-time high of $15.1799. However, currently the market is below the most recent buy fractal at $13.07 and if there is an hourly close below this level this will indicate bearish momentum. The relative strength index is just below 50 suggesting the market price should be lower and in line with the Ichimoku cloud around $12.60. Buying opportunities will be better once the relative strength index moves above 50.
The longer-term outlook is illustrated with the 4-hour chart below. The market has tested support provided by the conversion line at $12.875 but the market has remained to keep above this level, suggesting that the price will continue higher. A bearish outlook is only validated if there is a close below this level and below the base line at $12.59. These levels are good entries into long positions as they are key support levels. The most recent sell fractal is providing resistance at $13.44996 and a close above this level will give further bullish confirmation.
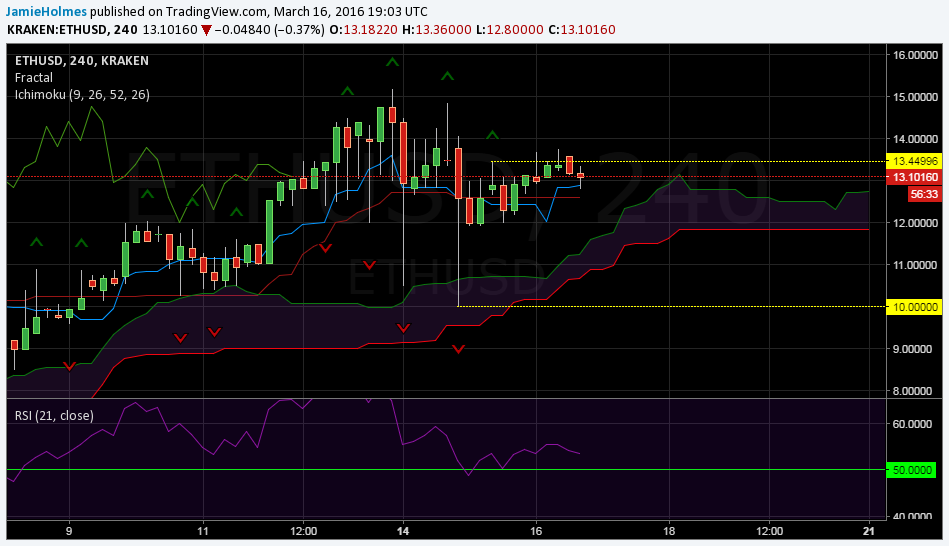
The Ichimoku cloud has stopped trending upward, and the fact that the relative strength index is trending lower indicates some weakness in the market. We could see some range trading inside the Ichimoku cloud around $11.83 and $12.75 if the relative strength index continues to flatline. Notice how when the $10 psychological handle was tested the 50 level acted as support for the relative strength index; going forward, a bullish outlook will be valid as long as the index remains or close to 50.