GME stock forms risky pattern as it face a double whammy


The GME stock price retreated by over 5% on Wednesday, reaching its lowest level since Nov. 26 as GameStop faced a double whammy of weak sales and the ongoing woes in the Bitcoin treasury industry.
- The GME share price pulled back after publishing its earnings.
- GameStop is facing a double whammy of slow growth and ongoing challenges among Bitcoin treasury companies.
- The weekly chart shows that the stock has formed a head-and-shoulders pattern.
GameStop stock dropped to $21.5, down by over 37% from its highest level this year, bringing its market capitalization from $15 billion to $10 billion.
GameStop published mixed financial results
The GME share price dropped sharply after the company published weak quarterly results that raised doubts about its strategy
Its revenue dropped to $821 million in the third quarter, down from the $860 million it made in the same period last year.
The decline happened primarily because of the changing American consumer in the gaming industry, with most people opting to game streaming and subscription.
At the same time, the company’s pivot to digital sales and collectibles is not working as fast as the management expected, with more consumers opting for companies like Amazon and eBay.
GameStop’s Bitcoin (BTC) accumulation strategy is also not working as the management expected. The value of its Bitcoin holdings ended the quarter at $534 million, a figure that has now tumbled to $434 million. Demand for Bitcoin treasury companies has tumbled in the past few months, with most of them, including Strategy and MetaPlanet, being in the red.
On the positive side, the company’s profitability rose, with the net income rising to $77 million from $17.4 million a year earlier. This profitability increased as the company reduced costs, with selling, general, and administrative expenses falling to $221 million from $282 million.
The other positive is that GameStop maintains one of the best balance sheets in the retail industry, with its cash and equivalents rising to $8.8 billion, its current assets rising to $9.6 billion, and its current liabilities falling to $932 million.
GME stock price technical analysis
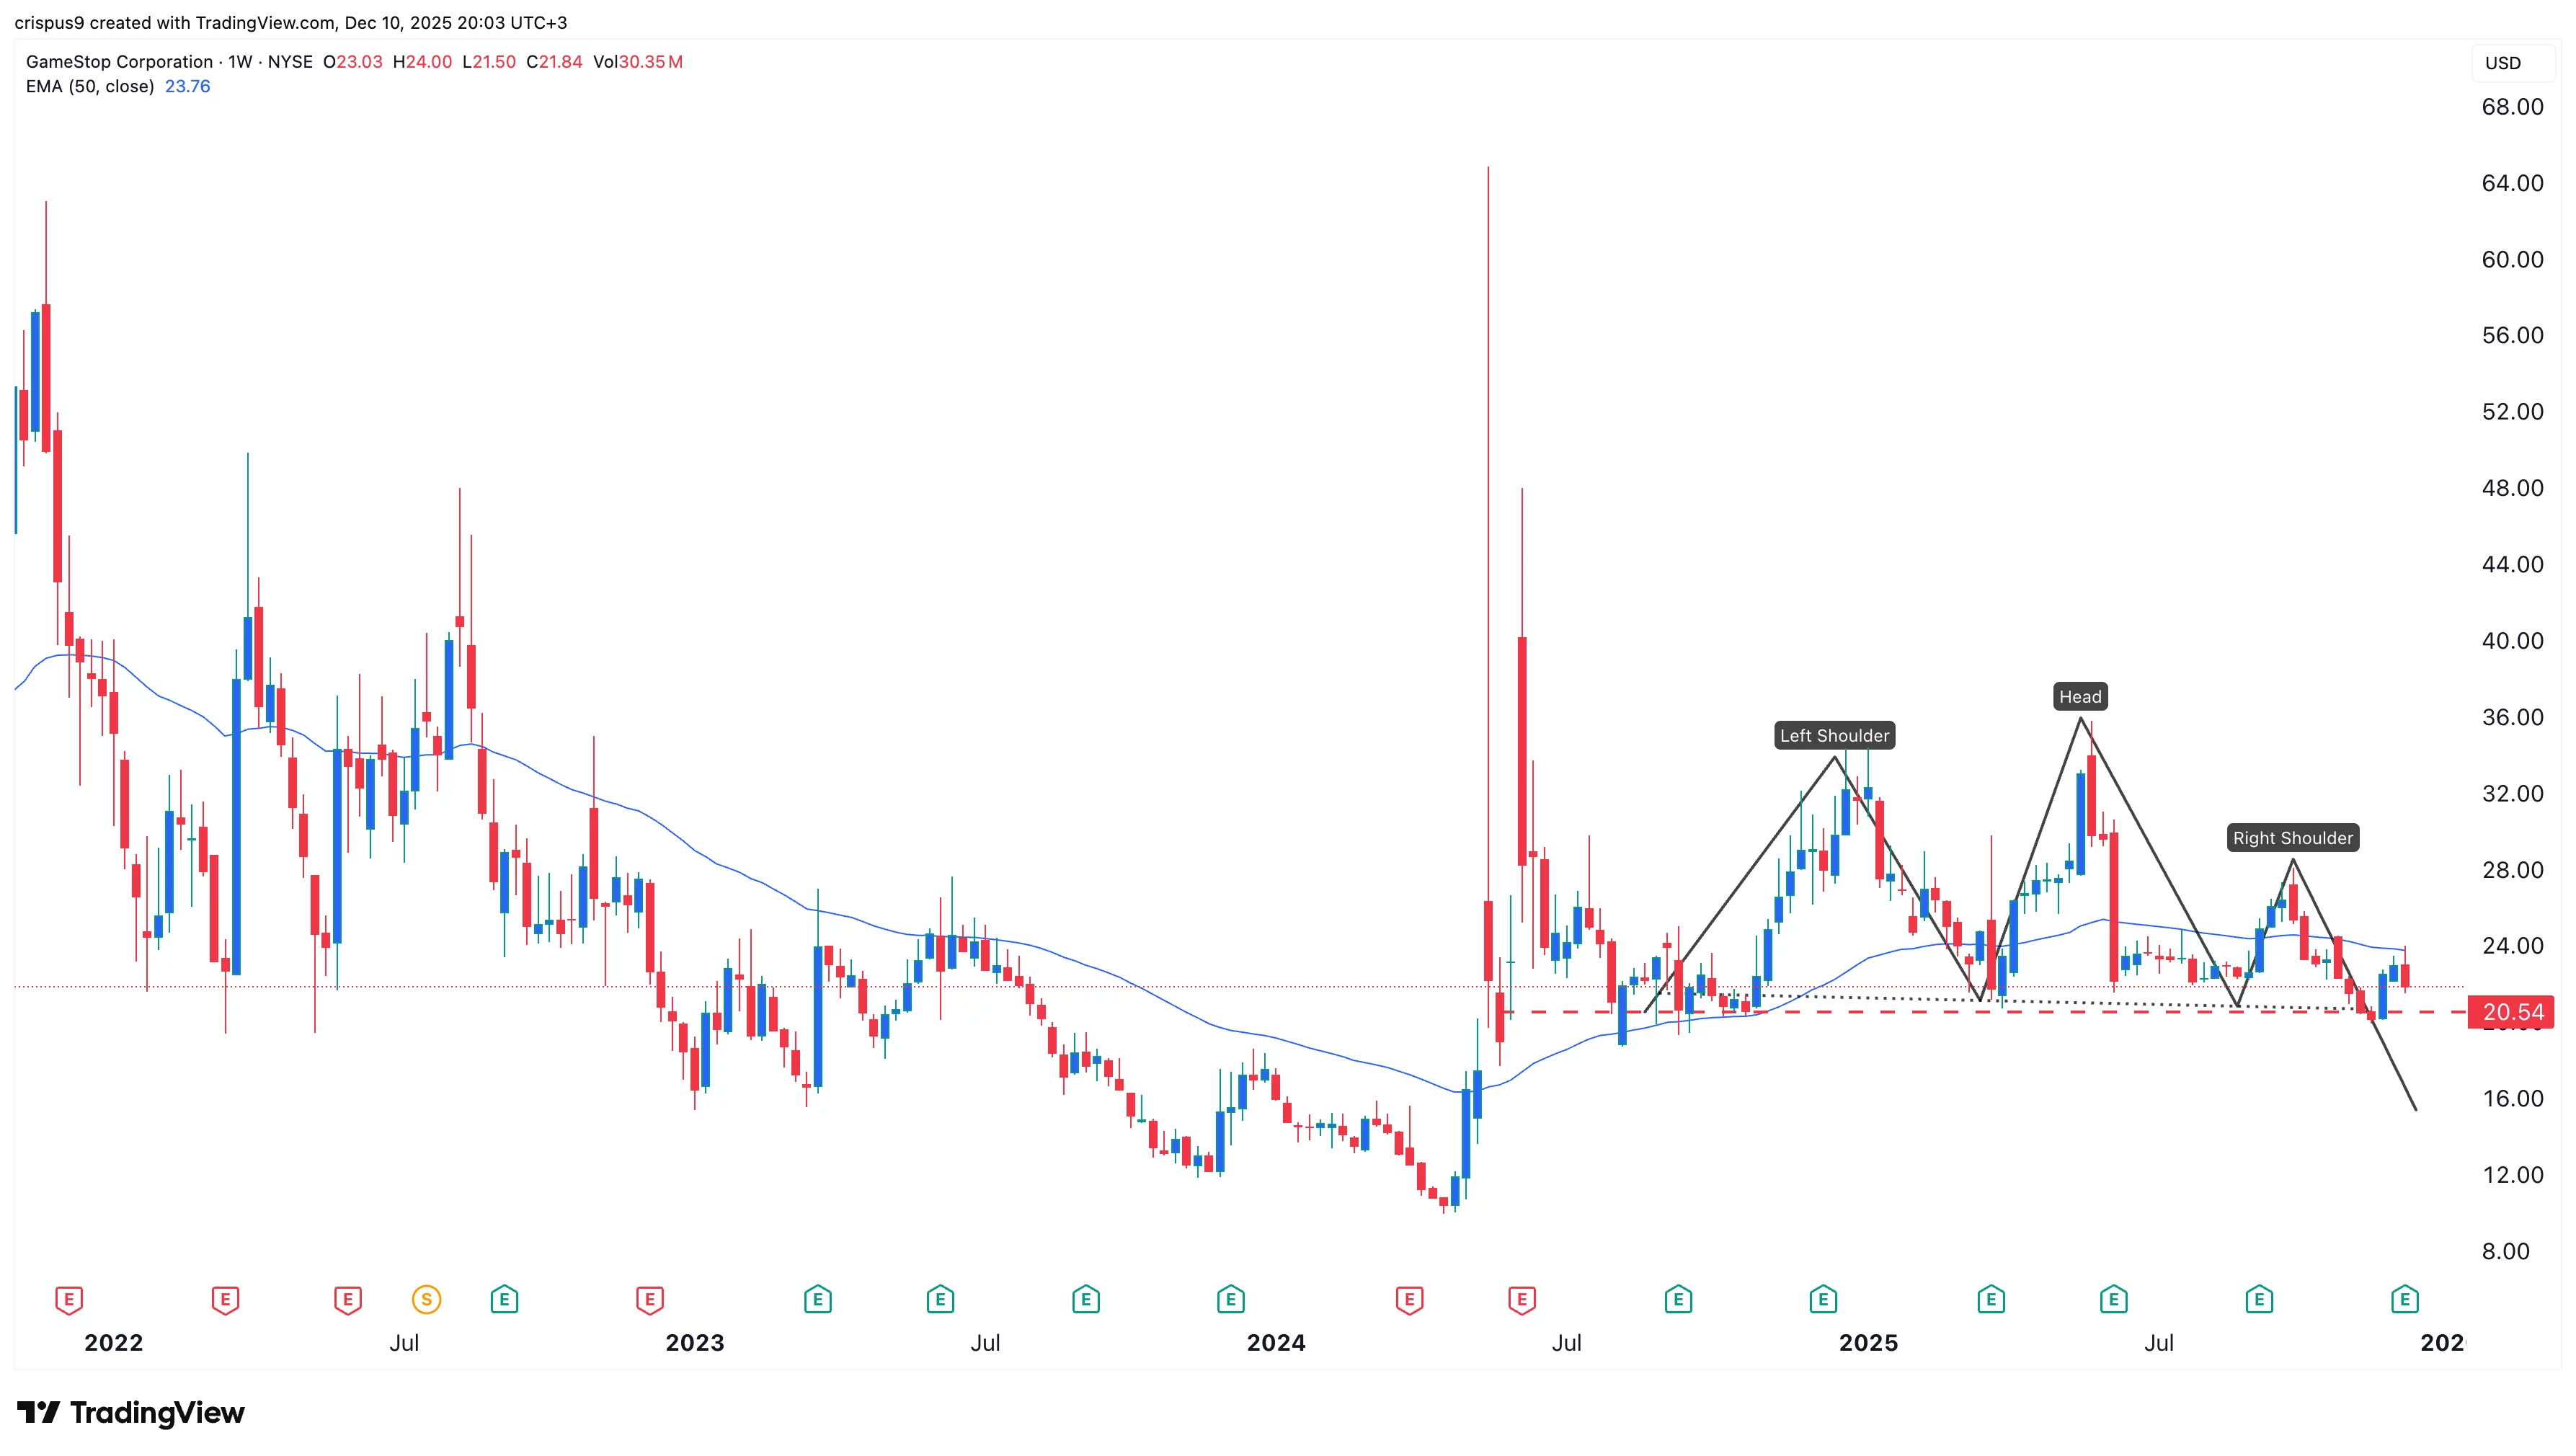
The weekly timeframe chart shows that the GME share price has come under pressure in the past few months, moving from the year-to-date high of $35.87 to $22.10.
A closer look shows that the stock has formed a head-and-shoulders pattern, with the head at $35.80 and the right shoulder at $29. It is one of the most common bearish reversal patterns in technical analysis.
GameStop stock is now hovering near that neckline at $20.55. It also remains below most trend indicators, such as moving averages and the Ichimoku cloud.
Therefore, the stock will likely continue falling as sellers target the psychological level at $20.