HBAR price at risk of a 27% plunge as Hedera stablecoins crash


Hedera Hashgraph token is at risk of a 27% crash as the supply of stablecoins in its ecosystem plummets.
Hedera (HBAR) has already declined by more than 57% from its highest point this year, mirroring the broader weakness across the cryptocurrency market.
Third-party data shows that the network’s stablecoin supply saw a sharp reversal this week, dropping to $50 million on Tuesday, down from a monthly high of $214 million.
A falling stablecoin supply is often viewed as a red flag for a layer-1 or layer-2 network, as it signals waning user activity. It also implies lower transaction fee revenue. For example, Tron (TRX) is currently the most profitable blockchain in crypto largely because it processes the highest volume of Tether (USDT) transactions.
Hedera’s chain fees have also declined significantly. After peaking at nearly $4,000 in May, network fees dropped to just $1,600 on Tuesday, likely due to the decline in stablecoin activity.
The total value locked in the Hedera Hashgraph network has fallen sharply, from over $352 million on June 10 to $175 million currently. Some of the largest decentralized applications in its ecosystem include Stader, SaucerSwap, Bonzo Finance, and HbarSuit.
In comparison, Hedera’s TVL is much smaller than some of the newer chains. For example, Berachain holds over $2.67 billion in TVL, while Sonic and Unichain have $1.6 billion and $850 million, respectively.
This trend is also reflected in the decentralized exchange (DEX) sector. Protocols on Hedera have processed just $203 million in volume over the past 30 days, whereas Unichain and Sonic recorded $11.2 billion and $3.8 billion, respectively.
HBAR price technical analysis
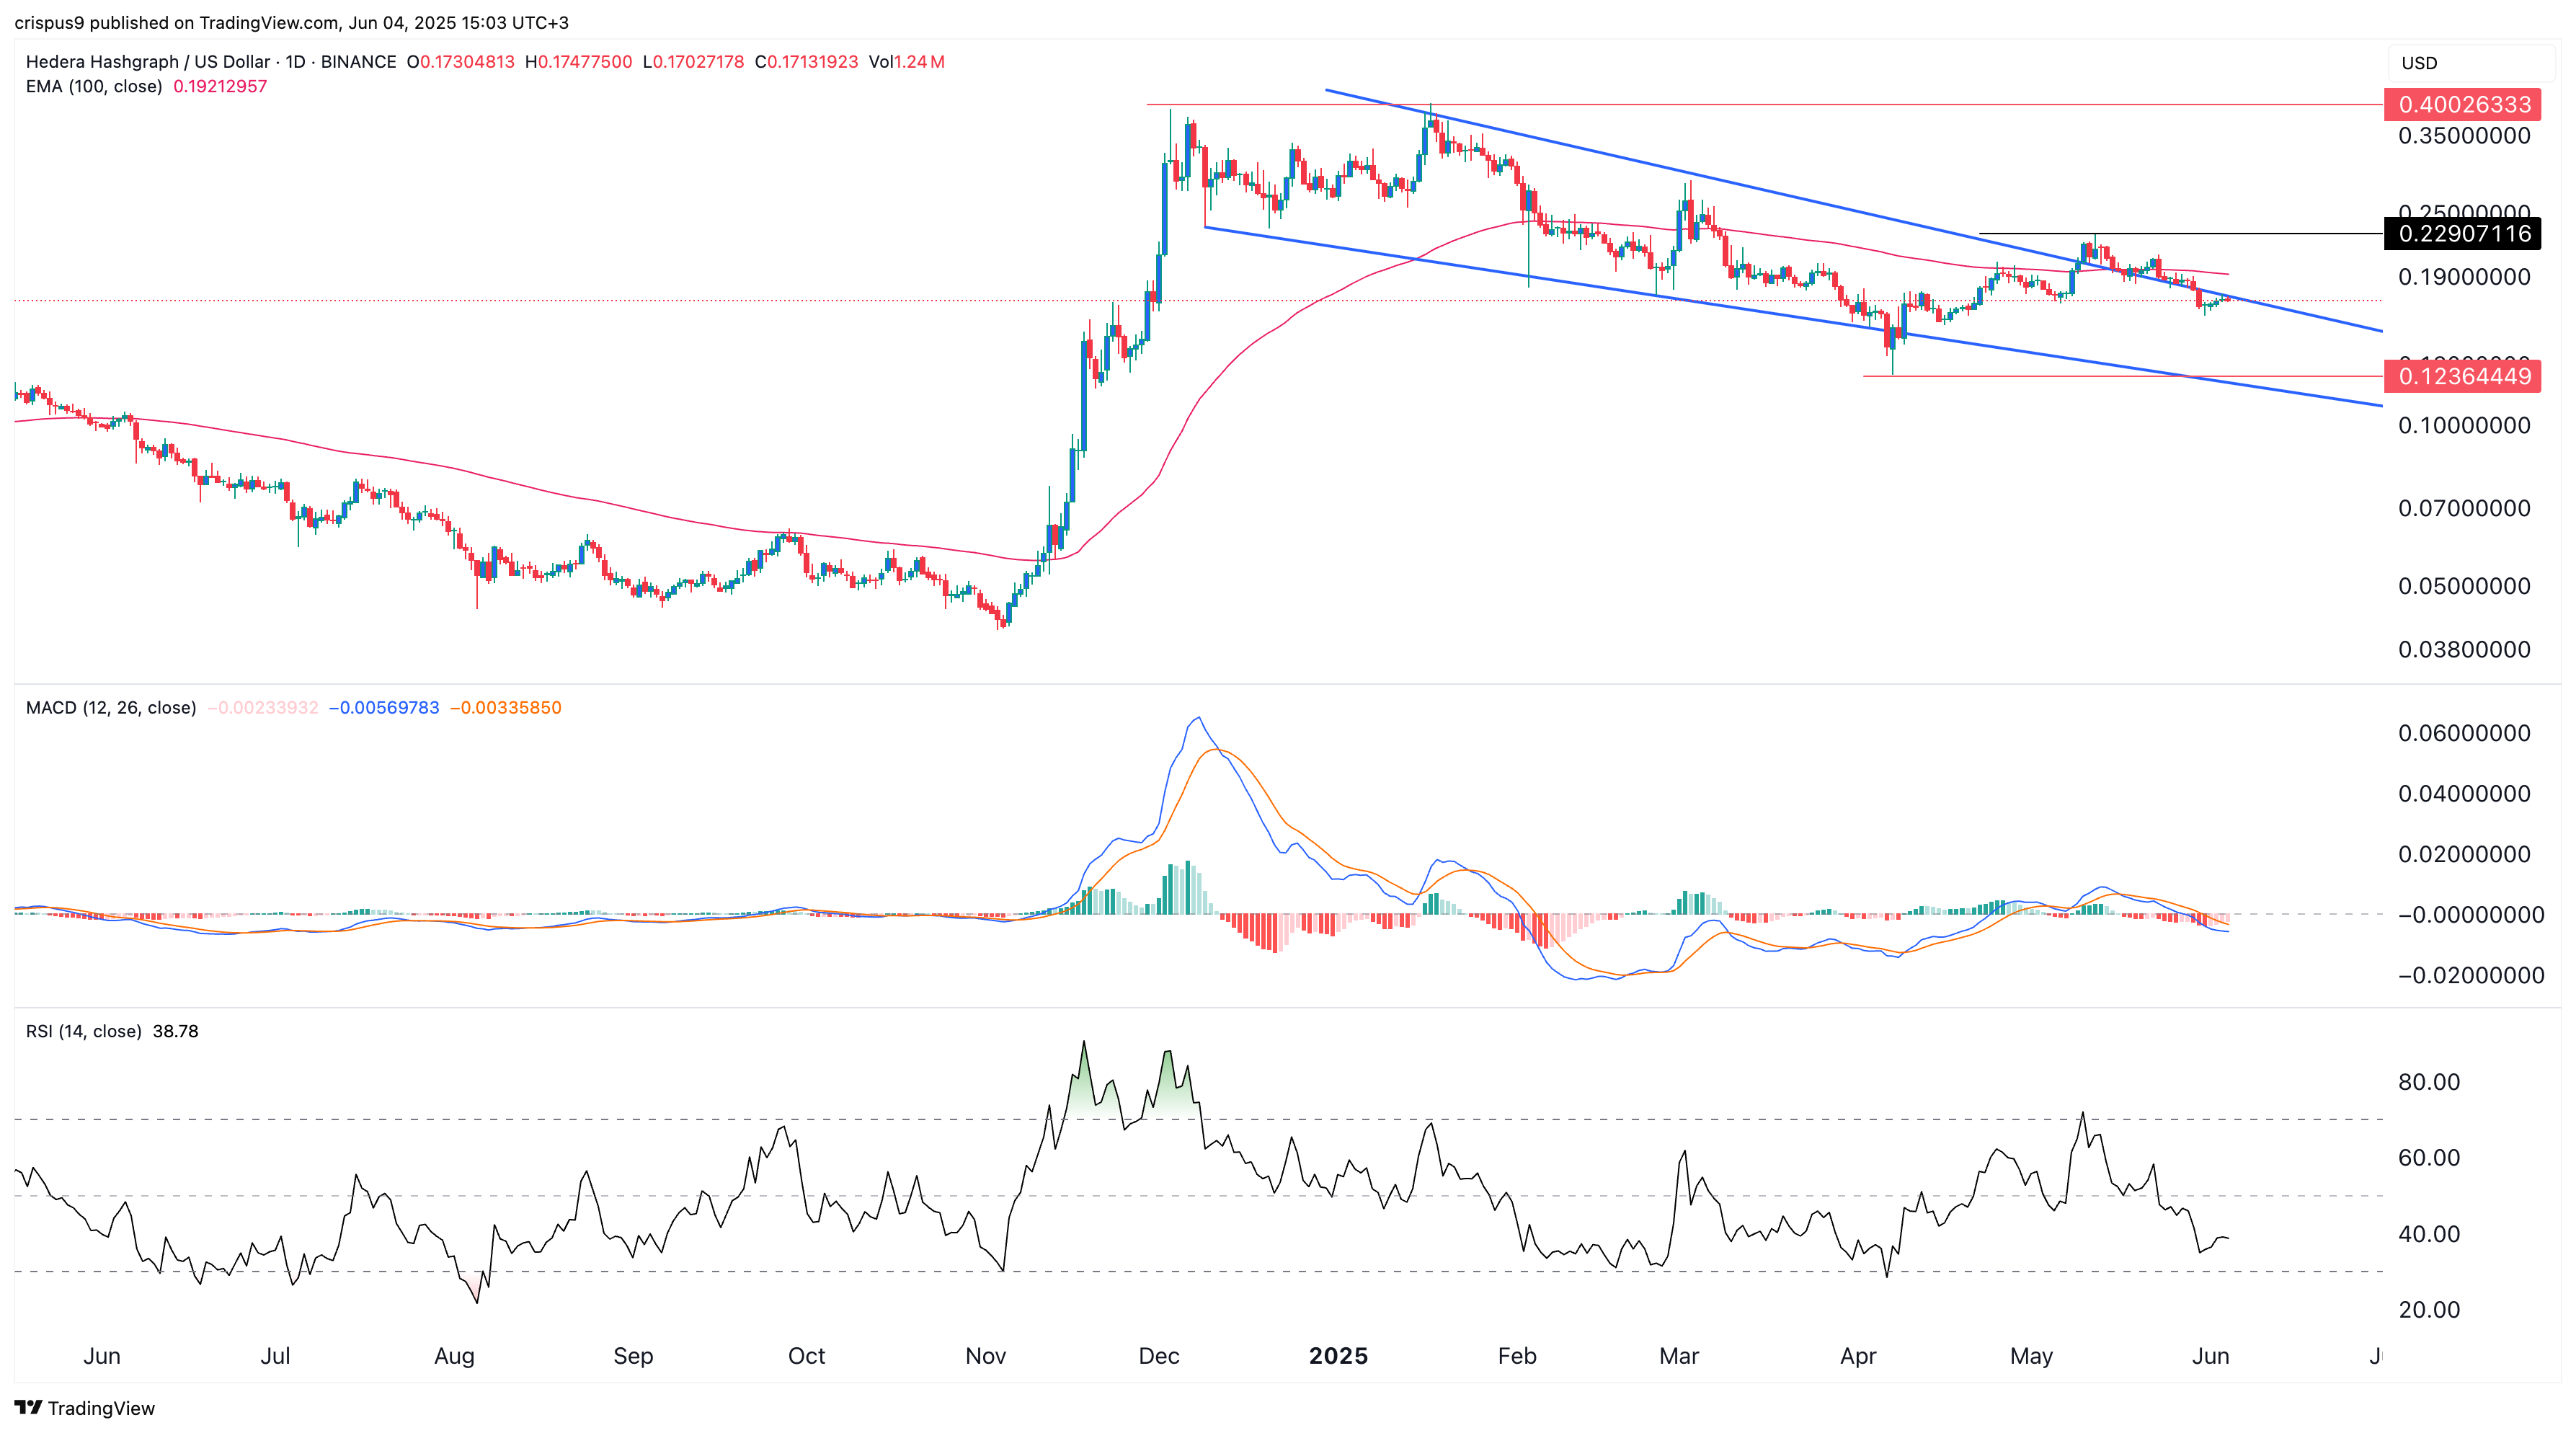
The daily chart shows that HBAR peaked and formed a double-top pattern near $0.40 in December and January. Since then, it has followed a bearish trajectory, forming a series of lower lows and lower highs, and is now trading just below the upper boundary of its descending channel.
The coin has also moved below the 50-day Exponential Moving Average, while the MACD and the Relative Strength Index have pointed downwards.
Given the weakening fundamentals and bearish technical indicators, there is a strong likelihood that HBAR will drop to the lower boundary of the channel at $0.1236, a potential 27% decline from current levels. A breakout above resistance at $0.2290 would invalidate this bearish outlook.