Hedera price flashes multiple breakout signals, targets 98% upside


Hedera price has been in a downtrend since August due to weakening activity over the network. However, Hedera now appears to be setting the stage for a major rebound as it eyes a breakout from multiple bullish patterns on the chart.
- Hedera price is up 9% over the past day.
- HBAR price action showed multiple bullish reversal patterns at play.
- A growing number of futures traders are starting to go long on HBAR.
According to data from crypto.news, Hedera (HBAR) price has fallen 13% over the past month and 51% from its highest point in July.
Hedera price declined due to a significant slowdown in on-chain activity, compounded by broader macroeconomic pressures, including renewed tariff threats from U.S. President Donald Trump. These developments have weighed on investor sentiment, dragging down Bitcoin (BTC) and other major cryptocurrencies, including HBAR.
While the launch of spot HBAR ETFs initially triggered optimism among investors and spurred some upside momentum, the enthusiasm quickly faded as the performance of HBAR ETFs lagged behind more dominant peers like Solana, resulting in what many viewed as a classic “buy the rumor, sell the news” event.
Data from SoSoValue shows that since launch, spot Solana ETFs have attracted total net inflows of $510 million, while HBAR ETFs have only drawn in $76 million during the same period.
Additional data from DeFiLlama shows the total value locked across Hedera’s DeFi applications has plummeted nearly 50% from July, standing at $157.9 million at the time of writing. The stablecoin supply on the network has also shrunk dramatically, falling from $224.5 million in August to just $72 million.
However, even as HBAR has been in a downtrend since August, some early signs have begun to develop that suggest the token could be on the verge of a turnaround.
Hedera price analysis
HBAR futures open interest has climbed 13% over the past 24 hours, and the long/short ratio is nearing 1. A rise in open interest alongside an improving long/short ratio typically means that bullish sentiment is growing and that traders are positioning for an upward move.
HBAR price has gained 9% over the past 24 hours and was trading at $0.14 at press time.
On the daily chart, HBAR price has been trading within a descending parallel channel pattern since July, marked by the asset moving with lower highs and lower lows within two downward-sloping trendlines. While this pattern usually precedes a period of sustained weakness, if a token manages to break out from the upper trendline, it is taken as a bullish reversal sign.
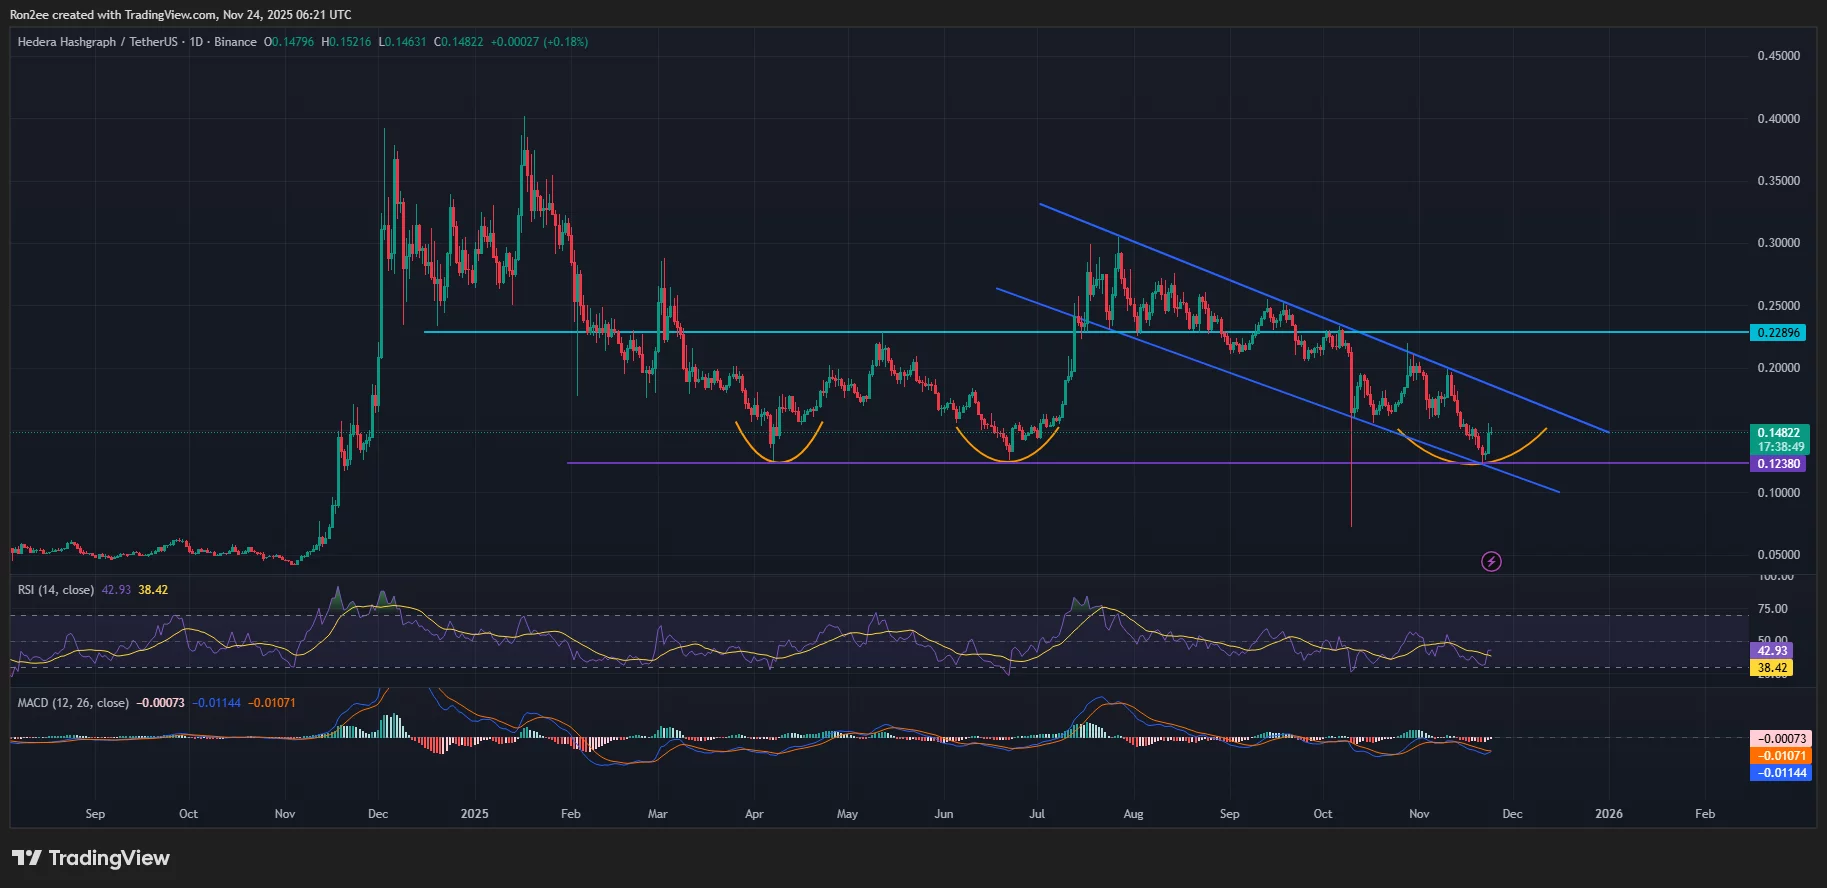
Adding to the bullish outlook, HBAR is in the process of forming a triple bottom pattern, which is widely viewed as a classic reversal signal. The three bottoms have formed around $0.123, with the neckline positioned at $0.228.
As such, the most probable target for HBAR next would be the $0.228 level, which is the neckline of the triple bottom pattern. The target lies nearly 98% above the current price.
At press time, momentum indicators have started to tilt in favor of the bulls. The MACD line is on the verge of crossing above the signal line, a potential bullish crossover, while the RSI has bounced back from oversold territory, signaling renewed buyer interest.
On the contrary, a drop below $0.123, which is the support level marking the triple bottoms, would invalidate the setup.
Disclosure: This article does not represent investment advice. The content and materials featured on this page are for educational purposes only.