Hedera tests key resistance: another macro lower high in the making?


Hedera’s recent pump has caught attention, but zooming out tells a different story. Price is tapping into a familiar technical zone that previously triggered a major drop, but will history repeat itself?
Despite a short-term rally, Hedera (HBAR) continues to trend lower on the higher time frames. The current price action mirrors a past setup that resulted in a significant macro lower high. This historical parallel presents a technical case for caution, especially as Hedera tests a critical resistance zone.
Key technical points
- Hedera is currently trading at the point of control and 0.618 Fibonacci—identical confluence to the last macro lower high.
- Volume remains below average, failing to support a sustained breakout.
- No daily candle closures above resistance confirms it as a valid rejection zone.
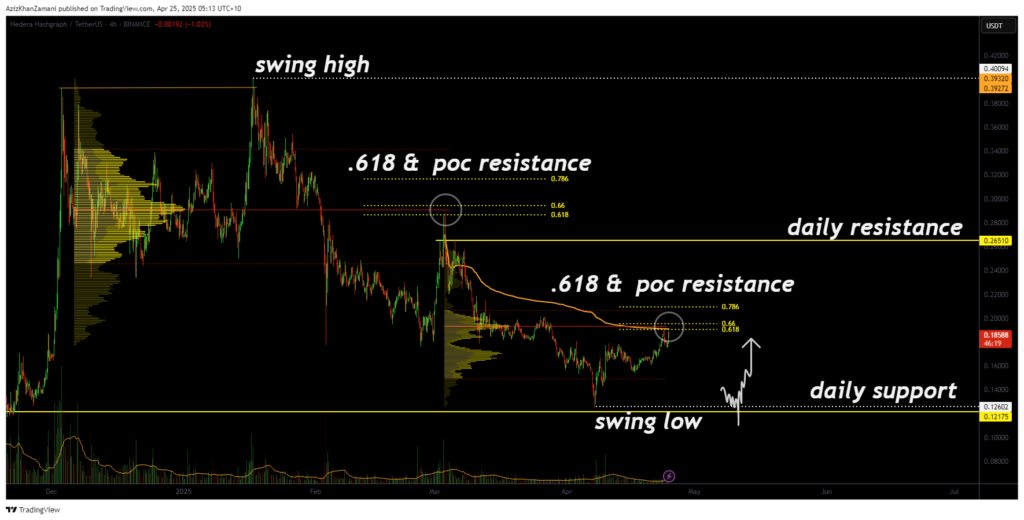
The high time frame structure for Hedera remains clearly bearish. Price action has been following a consistent pattern of lower highs and lower lows. The last major swing high formed when price tapped into the point of control and 0.618 Fibonacci retracement, exactly where Hedera is now.
This type of confluence is significant because it signals a zone where sellers have historically taken control. Currently, the volume profile shows no strong buy-side aggression, and the market is approaching this resistance with muted momentum. Without a convincing close above the level, this is simply another test of resistance within a larger downtrend.
The risk here is that this setup forms a new macro lower high, opening the path for a continuation move downward. The next key support below the current swing low sits at $0.12. A break below that would confirm the next leg down in this ongoing bearish structure.
What to expect in the coming price action
If Hedera confirms a rejection here, especially with a strong daily close below resistance, then it’s highly likely that we’ll see a rotation back toward the $0.12 region. This would not only continue the downtrend but also establish a fresh lower low.
However, if the resistance is broken with volume and sustained candles, it could flip the bias temporarily bullish. But until then, trend traders will view this as a short opportunity at key resistance.