Here’s why a Bitcoin price crash below $60,000 is likely


Bitcoin price has pulled back from its highest point this year as traders booked profits and trade-related risks persist.
- Bitcoin price has formed a rising wedge pattern on the weekly chart.
- It has also formed a bearish divergence pattern.
- A mean reversion could push it below $60,000 in the near term.
Bitcoin (BTC) was trading at $109,500 today, Oct. 23, down from the year-to-date high of $126,200, erasing billions of dollars in value. A closer look at the weekly chart shows that the coin has formed numerous bearish patterns that may drive it to levels below $60,000.
Bitcoin price technical analysis
The weekly timeframe chart shows that the BTC price has pulled back and moved into a correction after falling by over 10% from its highest point this year.
A closer look shows that the price has been forming a highly bearish rising wedge pattern, which could lead to more downside. This pattern started forming in December when Bitcoin crossed the important resistance at $105,000.
The lower side connects the lowest swings since September last year. In most cases, a bearish breakout happens when the two lines are nearing their confluence level, which is already happening.
The price target in a wedge pattern is estimated by measuring the widest section and then measuring the same distance from the breakout point. In this case, the widest point is about 45%. Measuring the same distance from the breakout point gives a price target of $58,890.
Bitcoin’s price has other bearish catalysts. For example, the price remains much higher than the 200-week moving average at $64,786. This is a sign that it may have a mean reversion, a situation in which an asset falls back to its historical average.
Additionally, the coin has formed a bearish divergence pattern as the Relative Strength Index, True Strength Index, and the Percentage Price Oscillator have moved downward as the price has moved upward.
Therefore, a combination of mean reversion, rising wedge pattern, and bearish divergence points to a breakdown. A move above the year-to-date high of $126,200 will invalidate the bearish forecast.
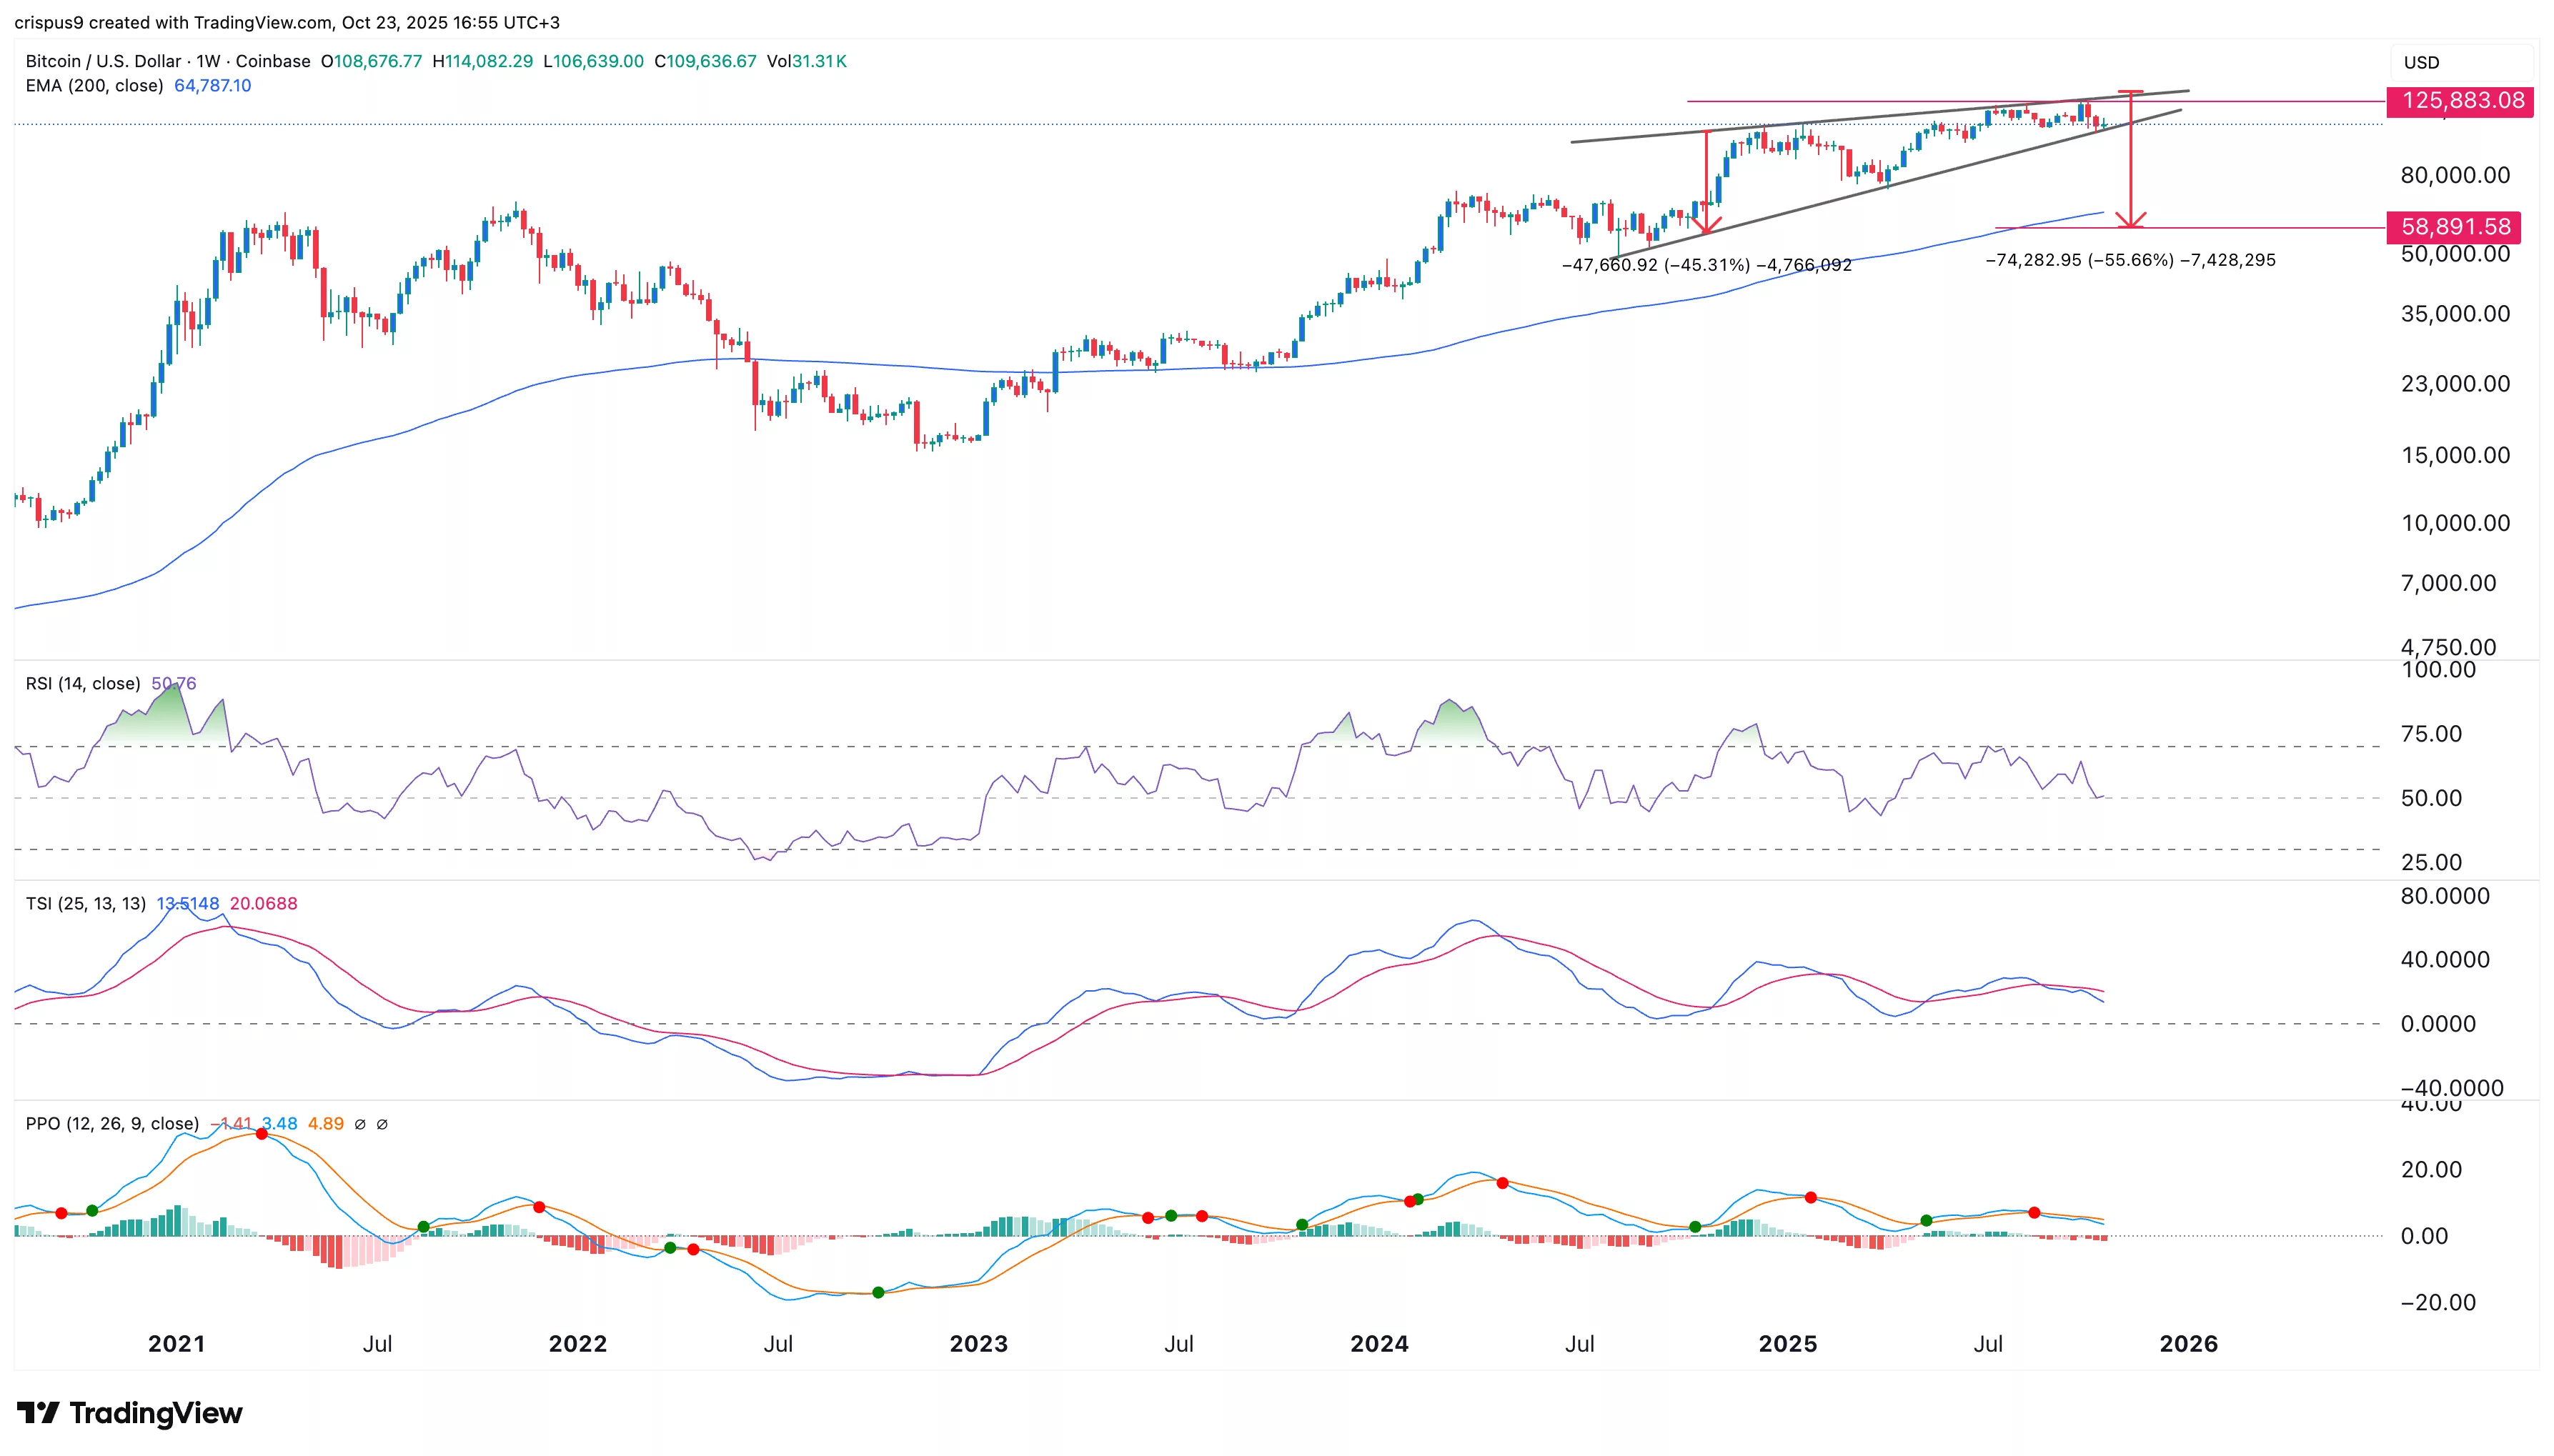
BTC price chart | Source: crypto.news
BTC price has had similar drawdowns before
A Bitcoin price crash to $58,000 would be a 55% plunge from its all-time high. While this is a big drop, the coin has had similar and even bigger drawdowns before.
For example, Bitcoin plunged by 77% from its highest point in 2022 to a low of $15,392. This crash happened as FTX and Terra crashed and as the Federal Reserve hiked interest rates to a multi-decade high.
Most recently, the Bitcoin price fell by 34% from its highest level in December to its lowest point in April this year. Bitcoin also fell by 55% from its April 2021 highs to its lowest point in June of that year.
All these plunges have been good entry points as the coin has always bounced back.