Here’s why AltLayer crypto is up 35% today


AltLayer’s native token, ALT, recorded a sharp rally on Monday, June 16, forming a notable breakout candle ahead of its listing on South Korea’s leading exchange, Upbit.
According to data from crypto.news, AltLayer (ALT) surged by 104% intraday, reaching a high of $0.051 before retracing to $0.033 at press time. Despite the pullback, ALT remained up 35% on the day, with its market cap at approximately $117 million, marking its highest valuation since early February.
ALT gained traction after it secured a listing on Upbit, a tier-1 crypto exchange in South Korea.
Listings on major centralized exchanges often drive short-term price appreciation as they expand liquidity access and investor reach. However, such listing-induced rallies can also be short-lived, as early participants frequently lock in gains once the news is priced in.
Notably, the Upbit announcement was met with aggressive whale accumulation. As highlighted by Korean market commentator Yoonseok, one whale acquired 1.6 million ALT tokens shortly after the listing news broke. Another whale reportedly purchased 2.93 million ALT at an average price of $0.04.
Such large inflows are often interpreted by retail investors as bullish signals, reinforcing upward price momentum.
Speculative appetite was evident in the derivatives market as well, with Coinglass data showing a 383% surge in open interest for ALT futures, with the long/short ratio remaining above 1. This means traders were predominantly taking long positions in hopes of further price appreciation.
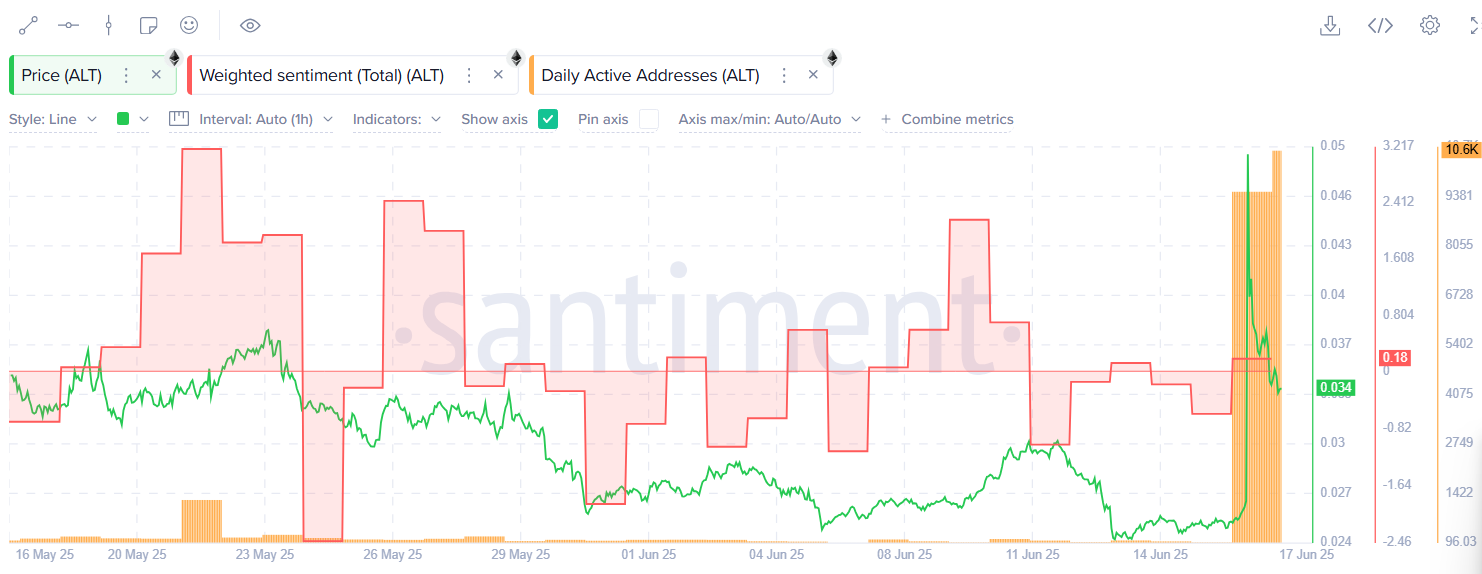
At the same time, onchain data from Santiment reported a sharp rise in daily active addresses, climbing from just 110 to over 10,500 in the past two days. The spike in user activity was accompanied by a positive shift in weighted social sentiment and a notable increase in Google search trends, indicating broader retail engagement.
ALT price analysis
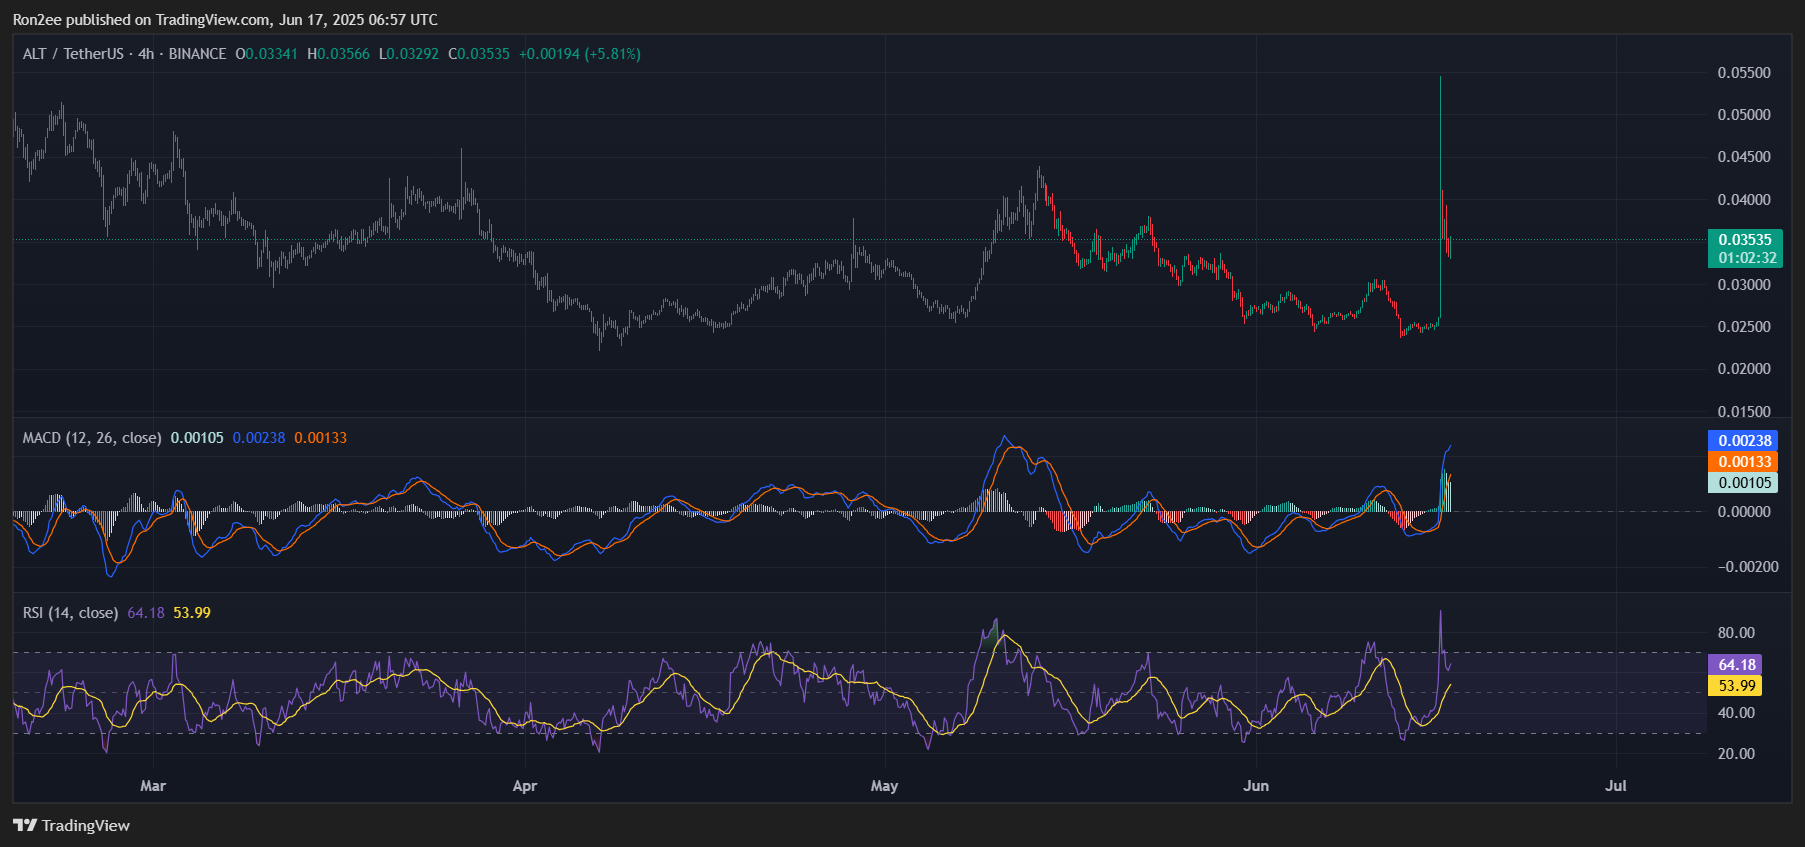
On the 4-hour USDT chart, both the MACD and RSI indicators are trending higher, suggesting strengthening bullish momentum.
Price action also shows that ALT remains above both the 50-period and 100-period EMAs, with the 50-day EMA having recently crossed above the 100-day EMA, a bullish crossover typically interpreted as a signal for trend continuation.
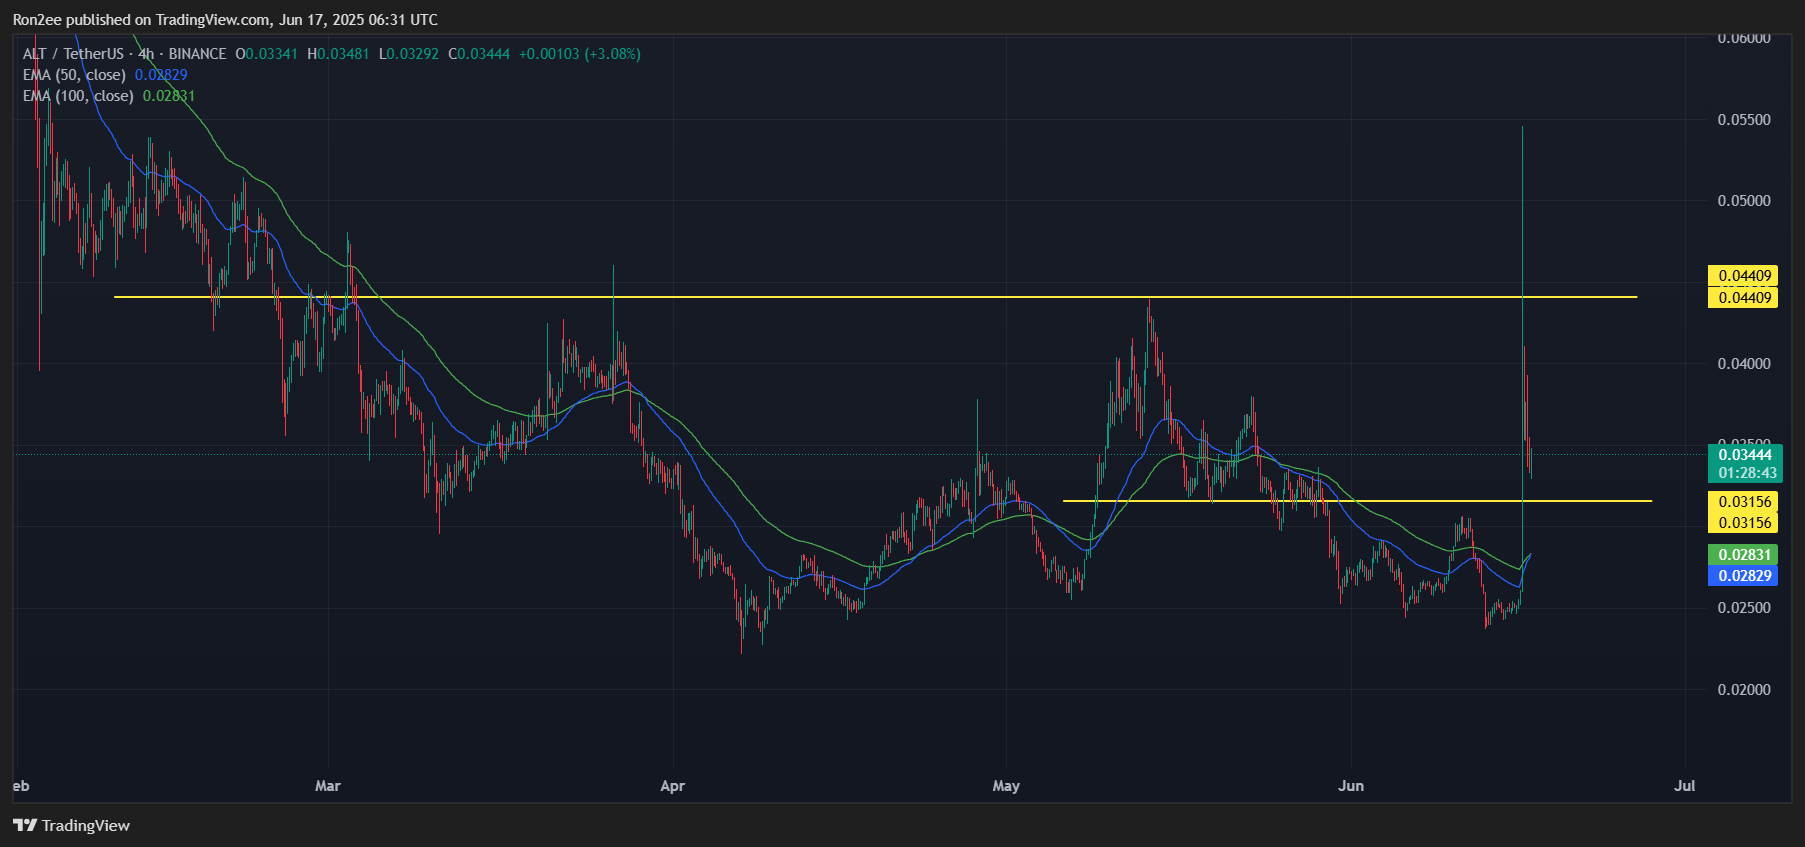
ALT is currently hovering above the $0.031 support level, which aligns closely with the May high of $0.044, now acting as a reference support zone.
If the token manages to rebound from current levels and sustain bullish momentum, a potential move toward $0.055 remains likely, a roughly 66% increase from the current price level.
Conversely, if the price breaks below the immediate support at $0.031, the next key level to watch would be around $0.023, which marked a local low on June 13. A decline toward this level would suggest a weakening of short-term bullish sentiment and may trigger further downside pressure.
Disclosure: This article does not represent investment advice. The content and materials featured on this page are for educational purposes only.