Here’s why SYRUP surged over 35% today


SYRUP jumped as much as 36% today, driven by strong ecosystem growth and whale accumulation.
On April 17, Maple Finance’s SYRUP token hit an intraday high of $0.15, putting it up more than 76% from its monthly low. At the time, its market cap sat around $128.8 million, and daily trading volume surged 157% to over $10.7 million.
Much of the hype came from rising demand in Maple’s derivatives market, too, as open interest in SYRUP futures shot up 90% in a day, reaching $359.6k.
The rally is largely tied to growing excitement around Maple Finance’s expanding ecosystem, which recently crossed $1 billion in total value locked, placing it ahead of competitors like Ondo Finance and Clearpool.
Community members pointed out that Maple is now almost halfway to catching up with BlackRock’s $2.46 billion BUIDL fund. BUIDL is a tokenized U.S. Treasury fund and one of the biggest real-world asset products on-chain.
Data from Dune Analytics shows this growth has been driven mostly by institutional demand for on-chain credit, powered by Maple’s syrupUSDC and lstBTC products. While syrupUSDC offers stable DeFi yields from lending, lstBTC gives institutions a way to earn returns on their Bitcoin without having to move assets from custodians.
Another factor contributing to SYRUP’s strong performance is its 10% yield, which is notably higher than other major platforms. By comparison, Ethereum staking yields range between 2.15% and 3.34%, while Solana offers approximately 5.64% to 8.25%.
Meanwhile, Whales have also shown interest in SYRUP, with data from Santiment showing an increase in the number of holders holding between 10,000 and 100 million SYRUP tokens, hinting that big investors are positioning for more upside ahead.
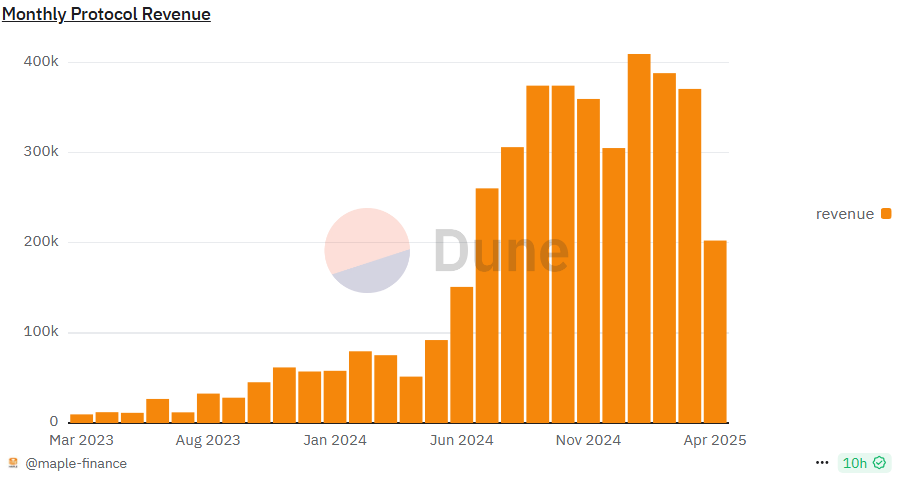
Maple’s revenue has also seen strong growth, rising from about $150K last June to nearly $370K last month.
Institutions have also started to take notice of the project, with Grayscale recently adding Maple to its Top 20 crypto list, saying it has strong potential for the coming quarter, adding to the project’s credibility.
SYRUP price analysis
Technical indicators also show signs that the ongoing rally still holds steam.
On the 4-hour USDT chart, SYRUP has formed an inverse head and shoulders pattern, a classic bullish setup.
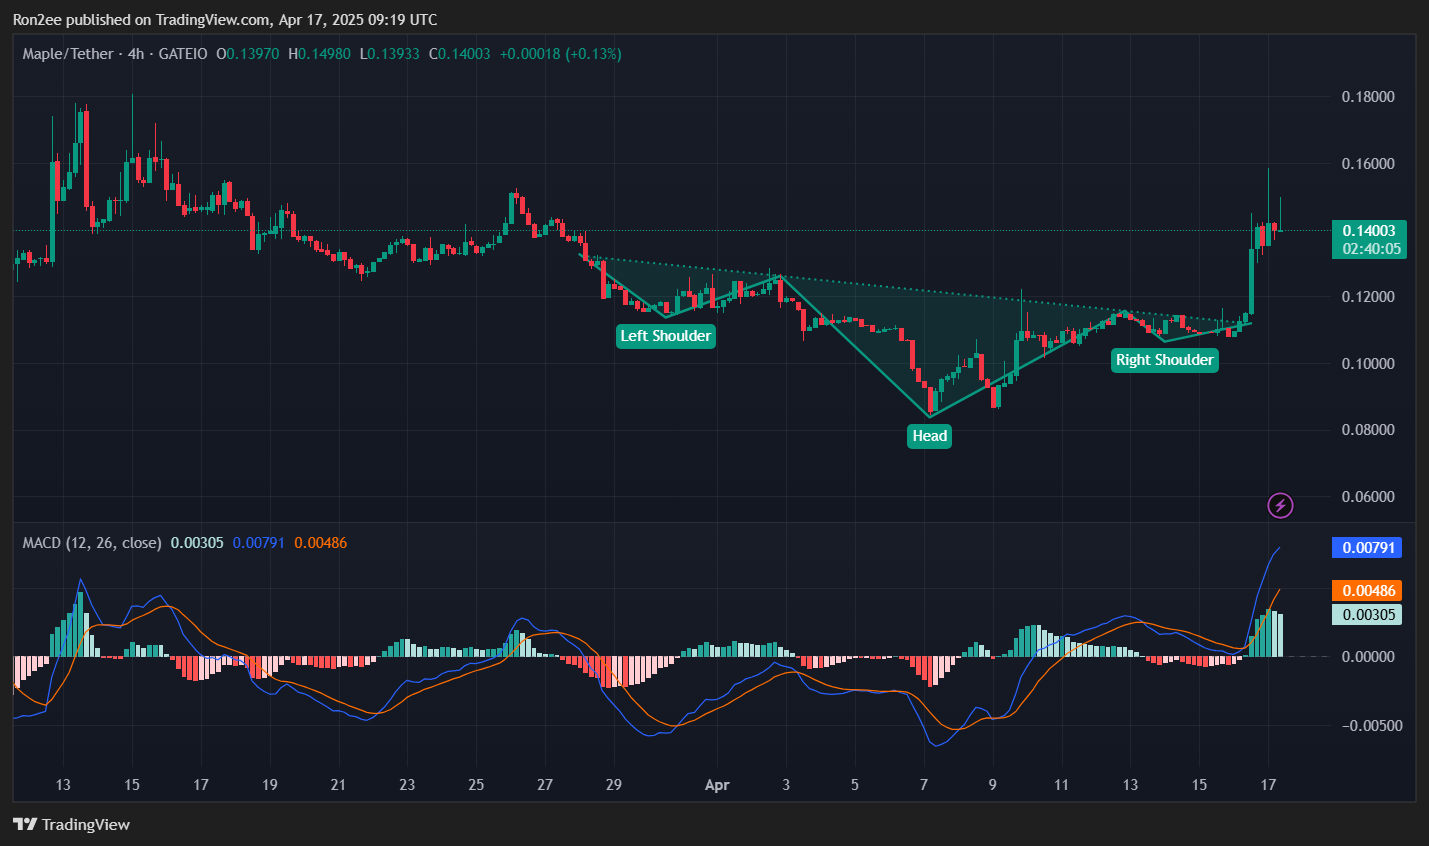
The MACD is also pointing upward, showing growing buying momentum, while the Supertrend indicator has flipped green, hinting that the trend might be shifting in the bulls’ favor.
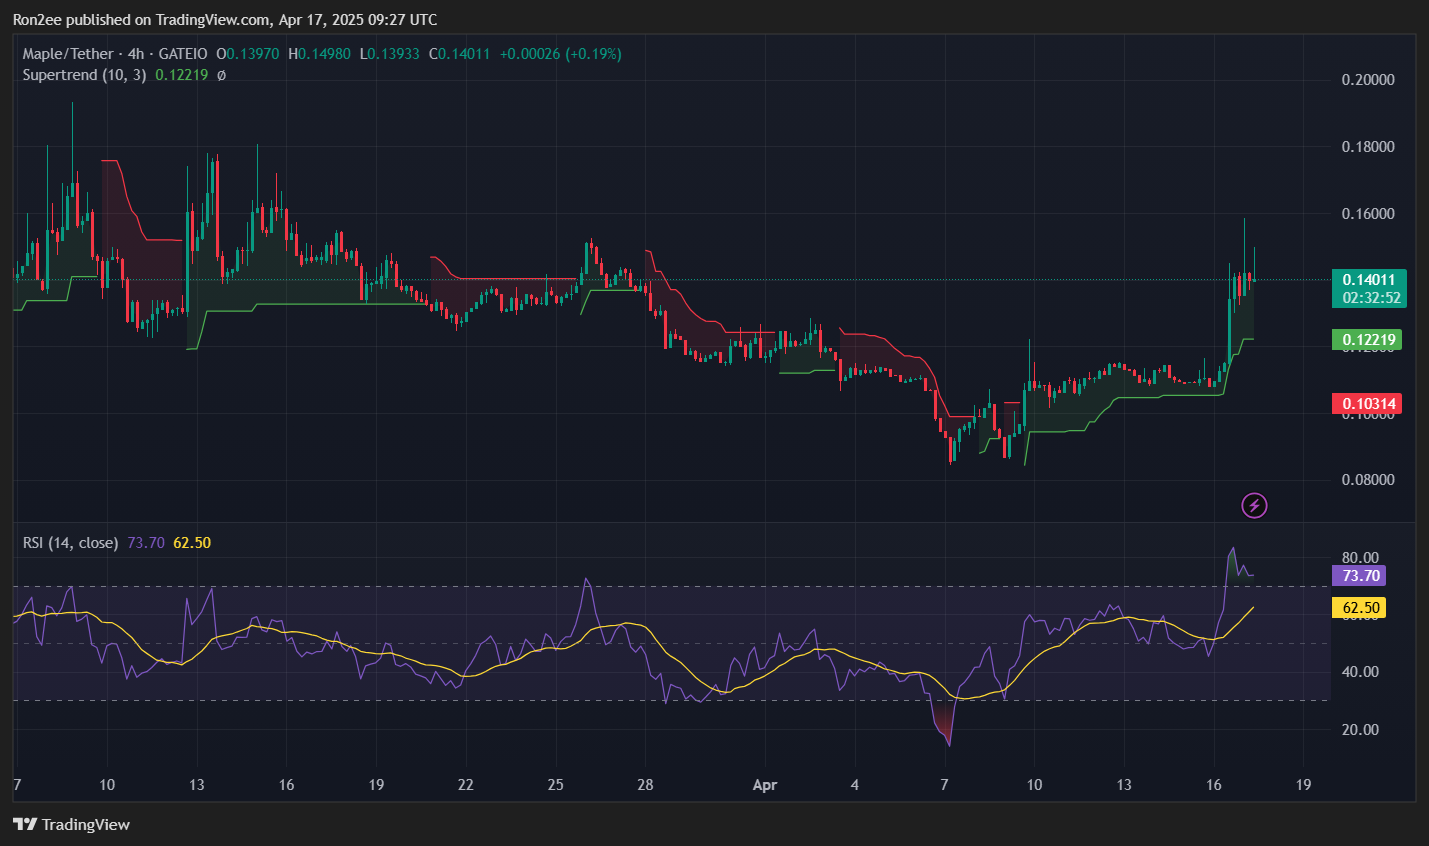
That said, the RSI has crossed into overbought territory, meaning a short-term pullback could happen before SYRUP continues its run.
If the rally holds, the next target is likely around $0.191, its March high, which is over 46% above the current price. But if the bullish setup fails, SYRUP could drop back to the key support at $0.10. Falling below that might open the door to a deeper drop toward $0.085.
Disclosure: This article does not represent investment advice. The content and materials featured on this page are for educational purposes only.