Housecoin rally loses steam after 600%+ surge as bullish momentum cools


Housecoin’s explosive rally may be losing steam, as momentum indicators point to a cooling trend following its parabolic 600% surge.
Launched in early April on the Solana (SOL) blockchain, Housecoin (HOUSE) is a memecoin satirically positioned as a hedge against the collapsing real estate market, using the tagline “Flipping the Housing Market, One $HOUSE at a Time.”
The memecoin has grabbed the spotlight after it had surged over 660% in just 2 days, climbing from $0.010 on March 25 to an intraday high of $0.076 on April 26, marking its ATH. Although it has since retraced to $0.060, it continues to show strong bullish momentum on the daily timeframe, with the daily RSI at 77.
The memecoin’s explosive price action caused it to trend on CoinMarketCap and CoinGecko over the weekend as degen traders moved to capitalize on its momentum. According to Lookonchain, one early investor converted $121,400 worth of Fartcoin (FARTCOIN) into 20.4 million HOUSE coins. By April 26, the value of their holdings had risen to $1.51 million, reflecting an unrealized profit of $1.4M.
HOUSE is mainly traded on decentralized exchanges, with PumpSwap accounting for about 35% of total trading volume and Meteora contributing about 16%. It has also been listed on some centralized exchanges, including MEXC, BitMart, and LBank.
On the 4-hour chart, however, signs of fading momentum are beginning to emerge. While Housecoin remains firmly above its 20-EMA, the price action has flattened, suggesting the initial wave of euphoria is cooling. After reaching an intraday high of $0.076, the coin has been consolidating sideways between $0.058 and $0.065 for the past 24 hours.
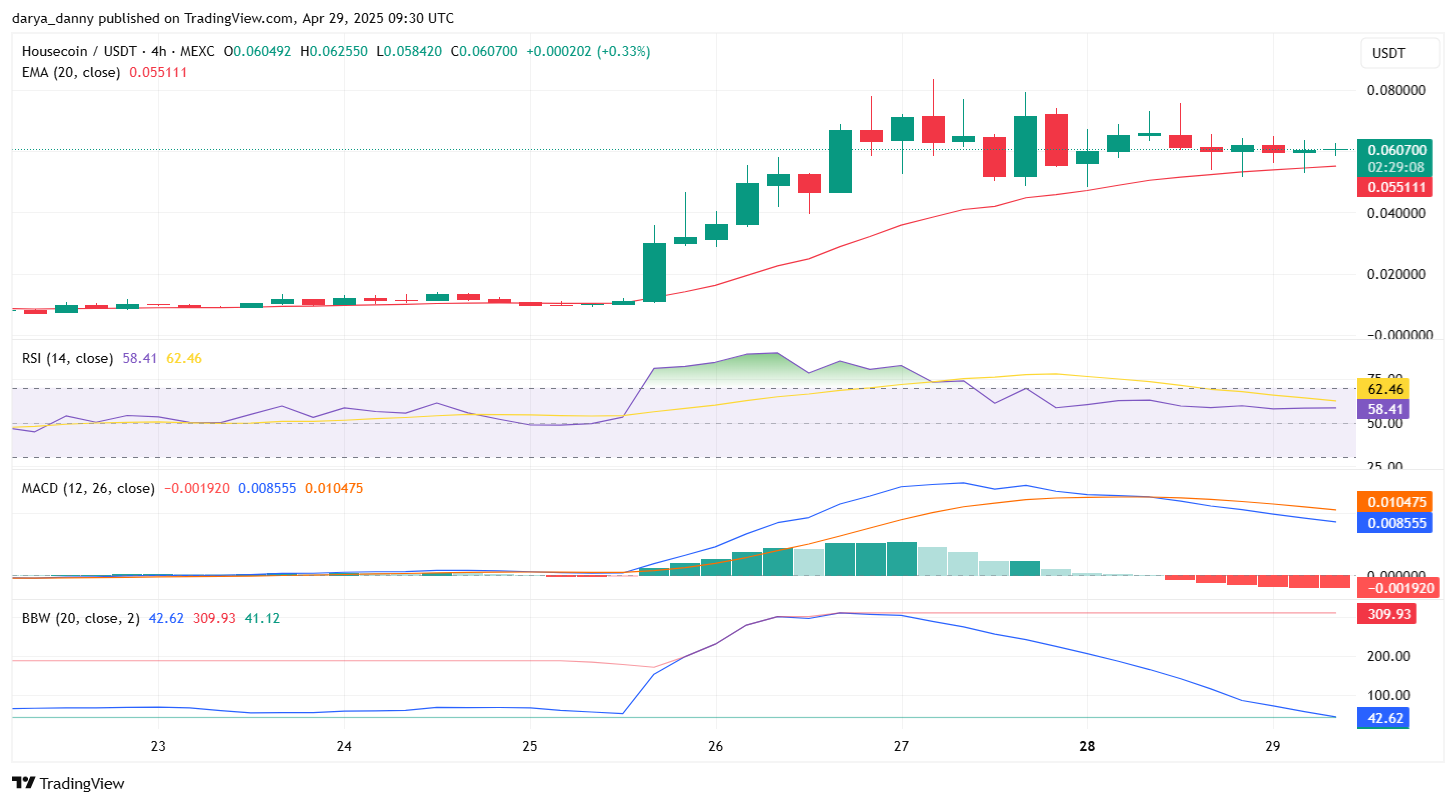
The RSI has slipped to 58.41, and while it remains above neutral, the sharp drop suggests traders are beginning to take profits and hesitate before entering new positions at higher prices. The MACD line has also crossed below the signal line for the first time since the rally began. This bearish crossover, combined with a shrinking histogram, is often a precursor to a short-term pullback or extended sideways movement. The Bollinger Band Width has narrowed dramatically, signaling declining volatility after the pump, suggesting price is entering consolidation.