How to track crypto whales: A comprehensive guide to market intelligence


Disclosure: This article does not represent investment advice. The content and materials featured on this page are for educational purposes only.
TraderMap helps crypto traders to track whale activity as institutional capital continues shaping market price movements.
- TraderMap launches as a unified dashboard for tracking whales, liquidations, and market news.
- TraderMap streams real-time data from exchanges including Binance, Bybit, and OKX.
- The platform aggregates whale trades, liquidations, and headlines into a single zero-latency crypto trading interface.
In the cryptocurrency market, price action is rarely random. It is driven by “Whales”— institutional entities and high-net-worth individuals who possess the capital necessary to shift market structures.
For the retail trader, success often depends on the ability to identify these “Smart Money” footprints before they result in massive price swings.
1. What is whale tracking, and why is it essential?
Whale tracking is the real-time monitoring of large-scale transactions, exchange inflows/outflows, and massive derivative positions.
The importance of the “smart money” flow
- Anticipating Volatility: Large players often position themselves in real-time before major volatility manifests on standard candlestick charts.
- Identifying Accumulation: Monitoring whale trades exactly as they open provides a clear map of institutional movement.
- Avoiding “Retail Traps”: Price spikes are often driven by retail FOMO; whale data helps you distinguish between retail hype and genuine institutional accumulation.
To capture these movements effectively, traders need zero-latency data. Professional tools utilize direct websocket feeds from major exchanges to ensure moves are seen the millisecond they occur, eliminating the “fog” of lagging indicators.
2. Which platform can be used for tracking?
For active traders, the choice of platform is the difference between leading the market and following the noise. While standard blockchain explorers are useful for historical audits, they are far too slow for real-time execution in a market that moves in milliseconds.
TraderMap: The professional standard
For those who prioritize speed, accuracy, and efficiency, TraderMap serves as the definitive centralized command center. It is specifically engineered to eliminate “tab-switching” fatigue — the seconds lost jumping between different sites for prices, news, and alerts — by centralizing everything into a single, zero-latency view.
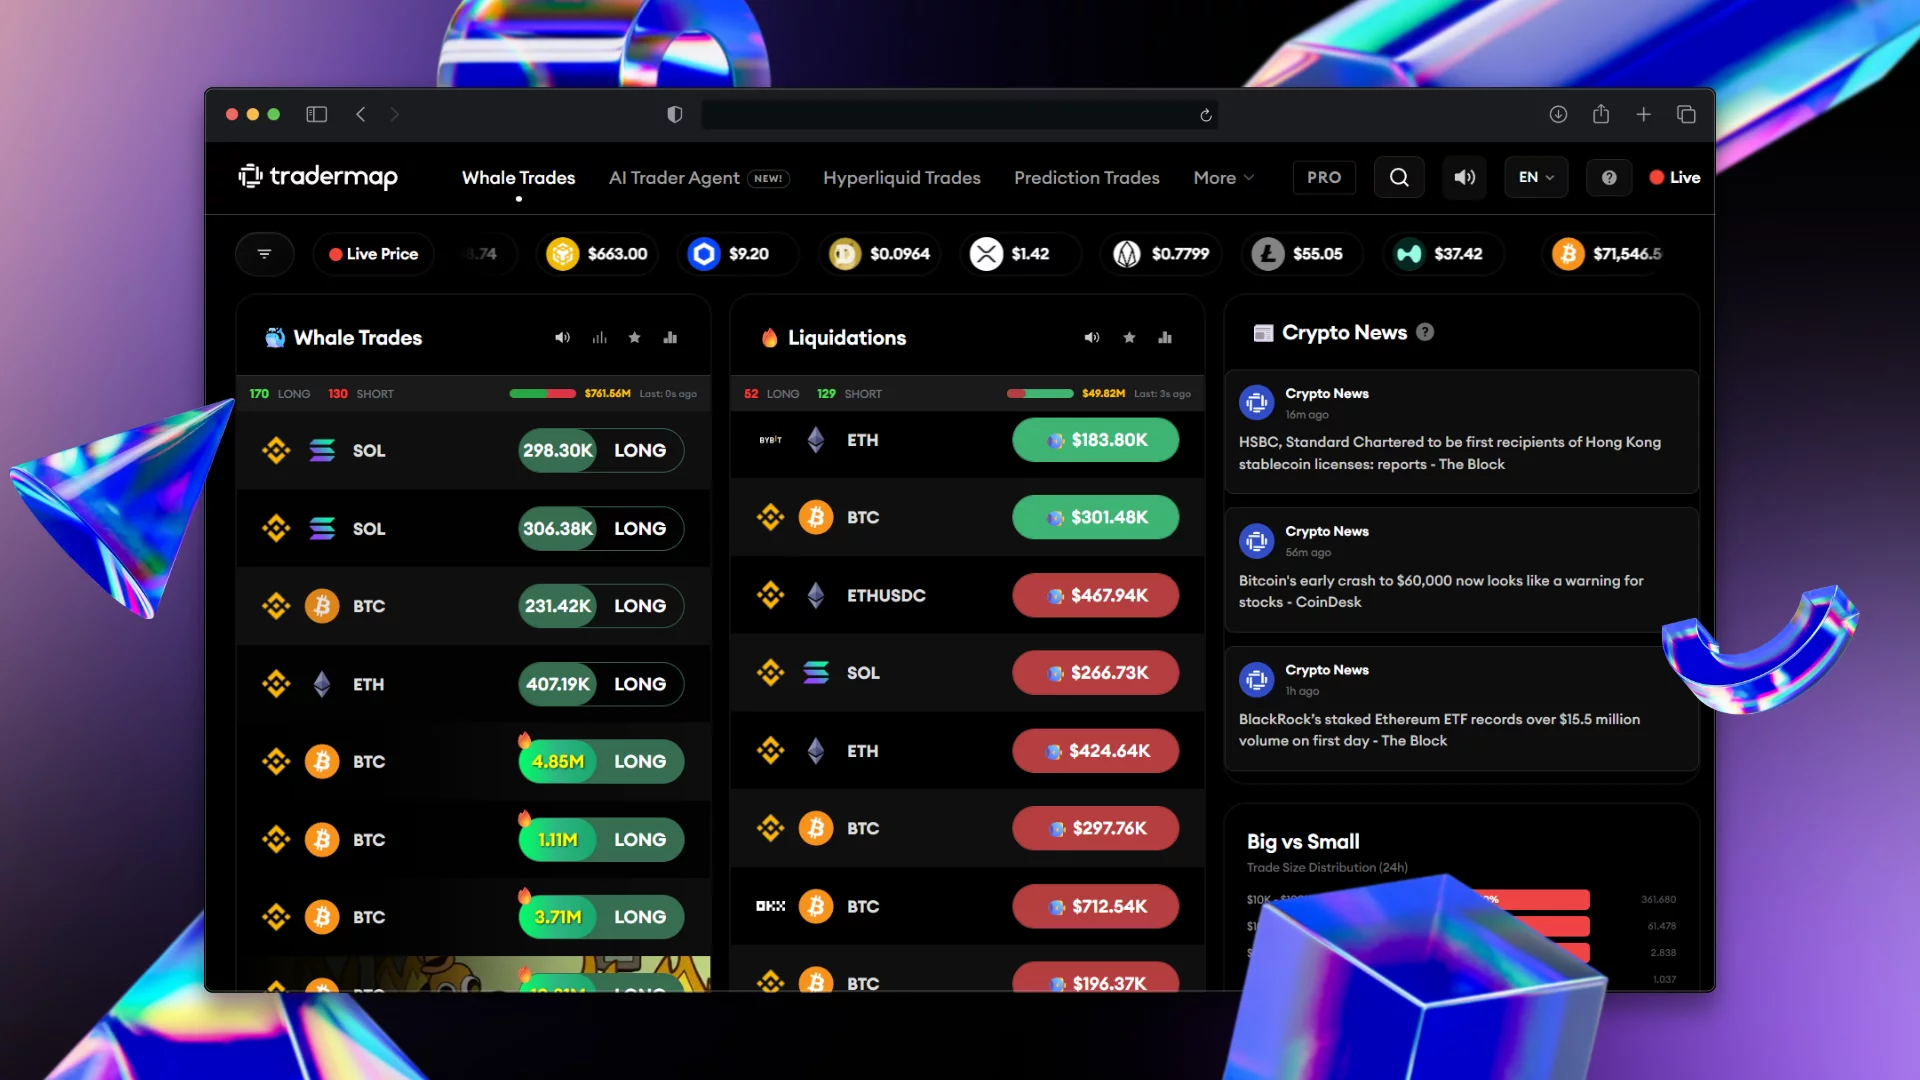
TraderMap changes the tracking experience by consolidating high-criticality data streams:
- Live Whale & Hyperliquid Trades: Monitor massive institutional positions and high-conviction moves exactly as they open.
- Real-Time Liquidations: Identify exactly where market leverage is being “flushed out” to find superior entry points during periods of maximum retail pain.
- Integrated News Feed: Headlines appear directly alongside price action, ensuring you understand the “why” behind every sudden volatility spike without leaving the interface.
- Zero-Latency Infrastructure: Powered by direct websocket feeds from major exchanges like Binance, Bybit, OKX, and Hyperliquid, the platform delivers data at the speed used by institutional desks.
3. Step-by-Step: Mastering whale tracking with TraderMap
Tracking whales effectively requires filtering out the “noise” of small retail trades. Here is how to use the TraderMap toolkit to isolate high-conviction moves:
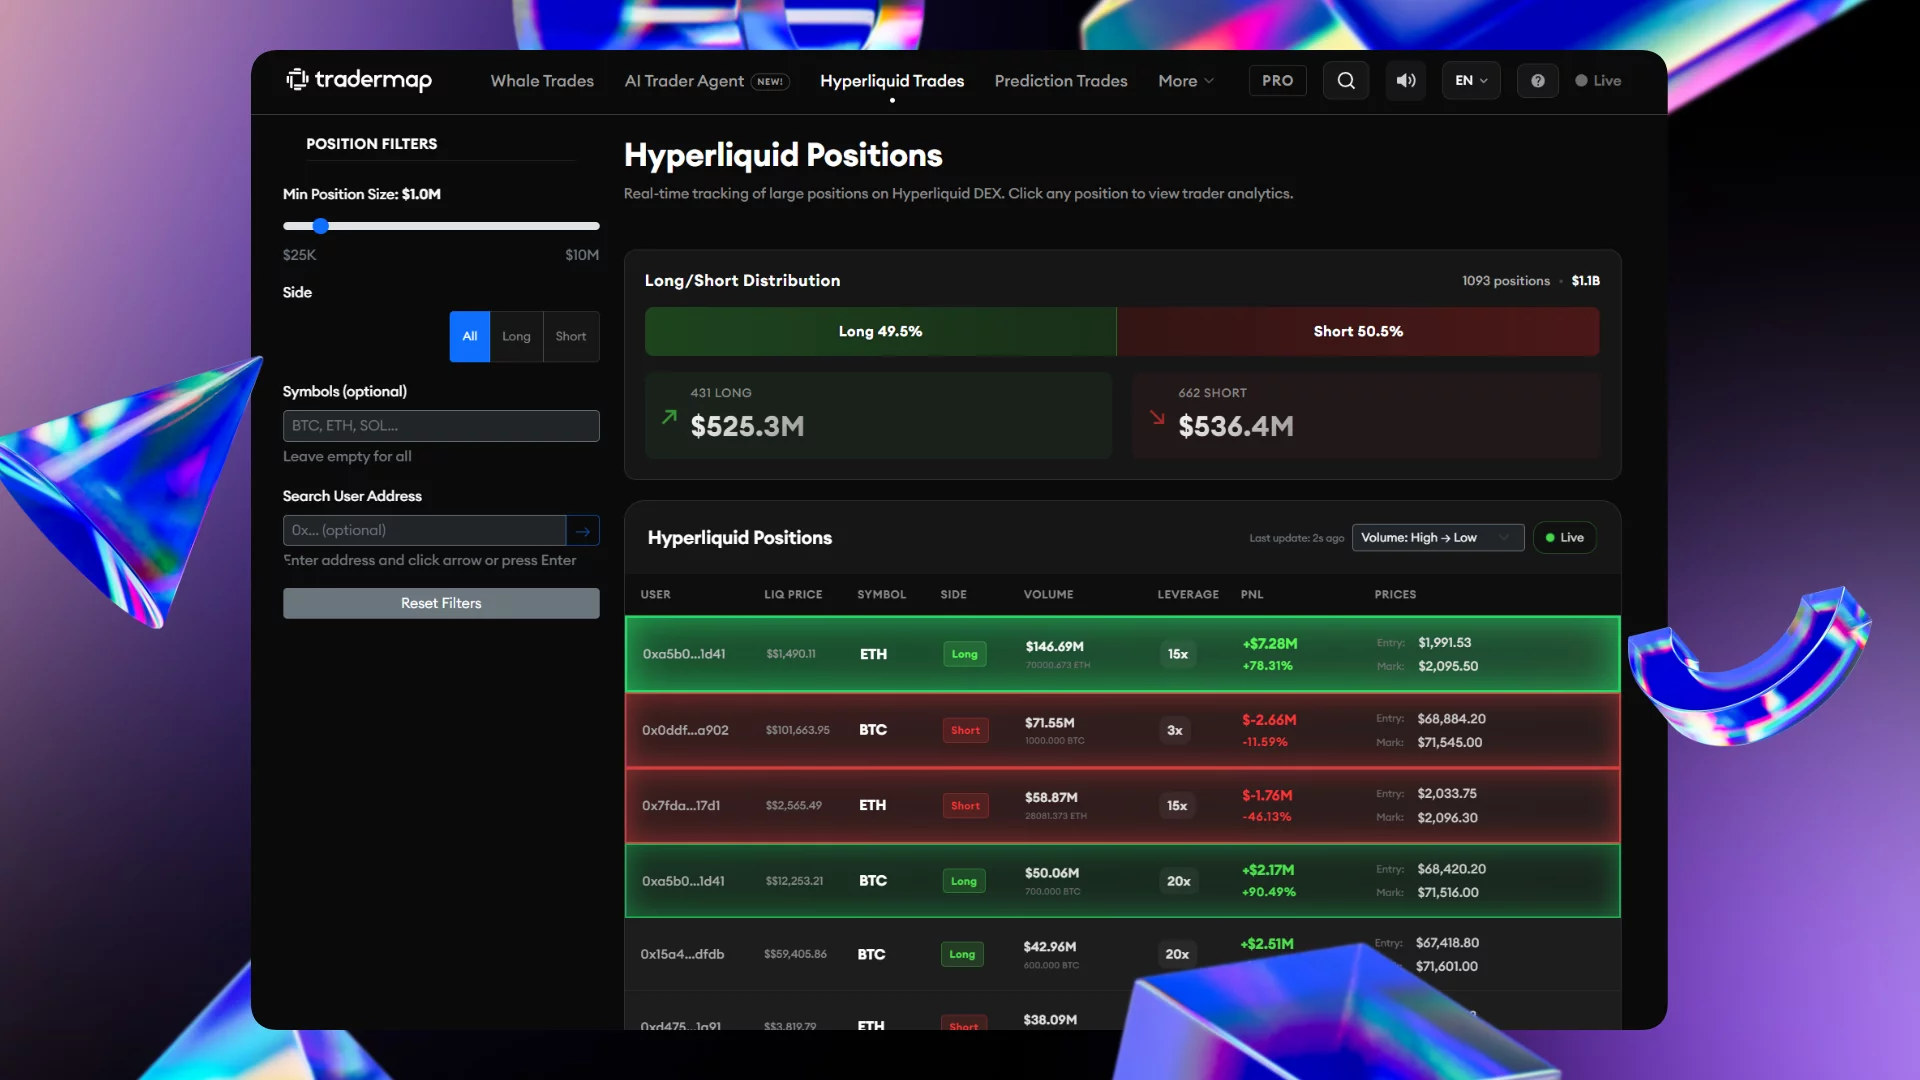
Step 1: Set filters
Navigate to the Position Filters section. To find the “real” money, set the Min Position Size to a significant threshold, such as $1.0m. This ensures feed is only populated by institutional-grade entries.
Step 2: Monitor Hyperliquid positions
Advanced traders use the Hyperliquid Trades section to track large-scale decentralized derivative positions.
- Address Search: If a consistently profitable whale is identified, use the Search User Address feature to track their specific entries and leverage in real-time.
- Long/Short Distribution: Monitor the visual distribution bar (e.g., 62% Long vs. 38% Short) to gauge the immediate directional bias of the market’s biggest players.
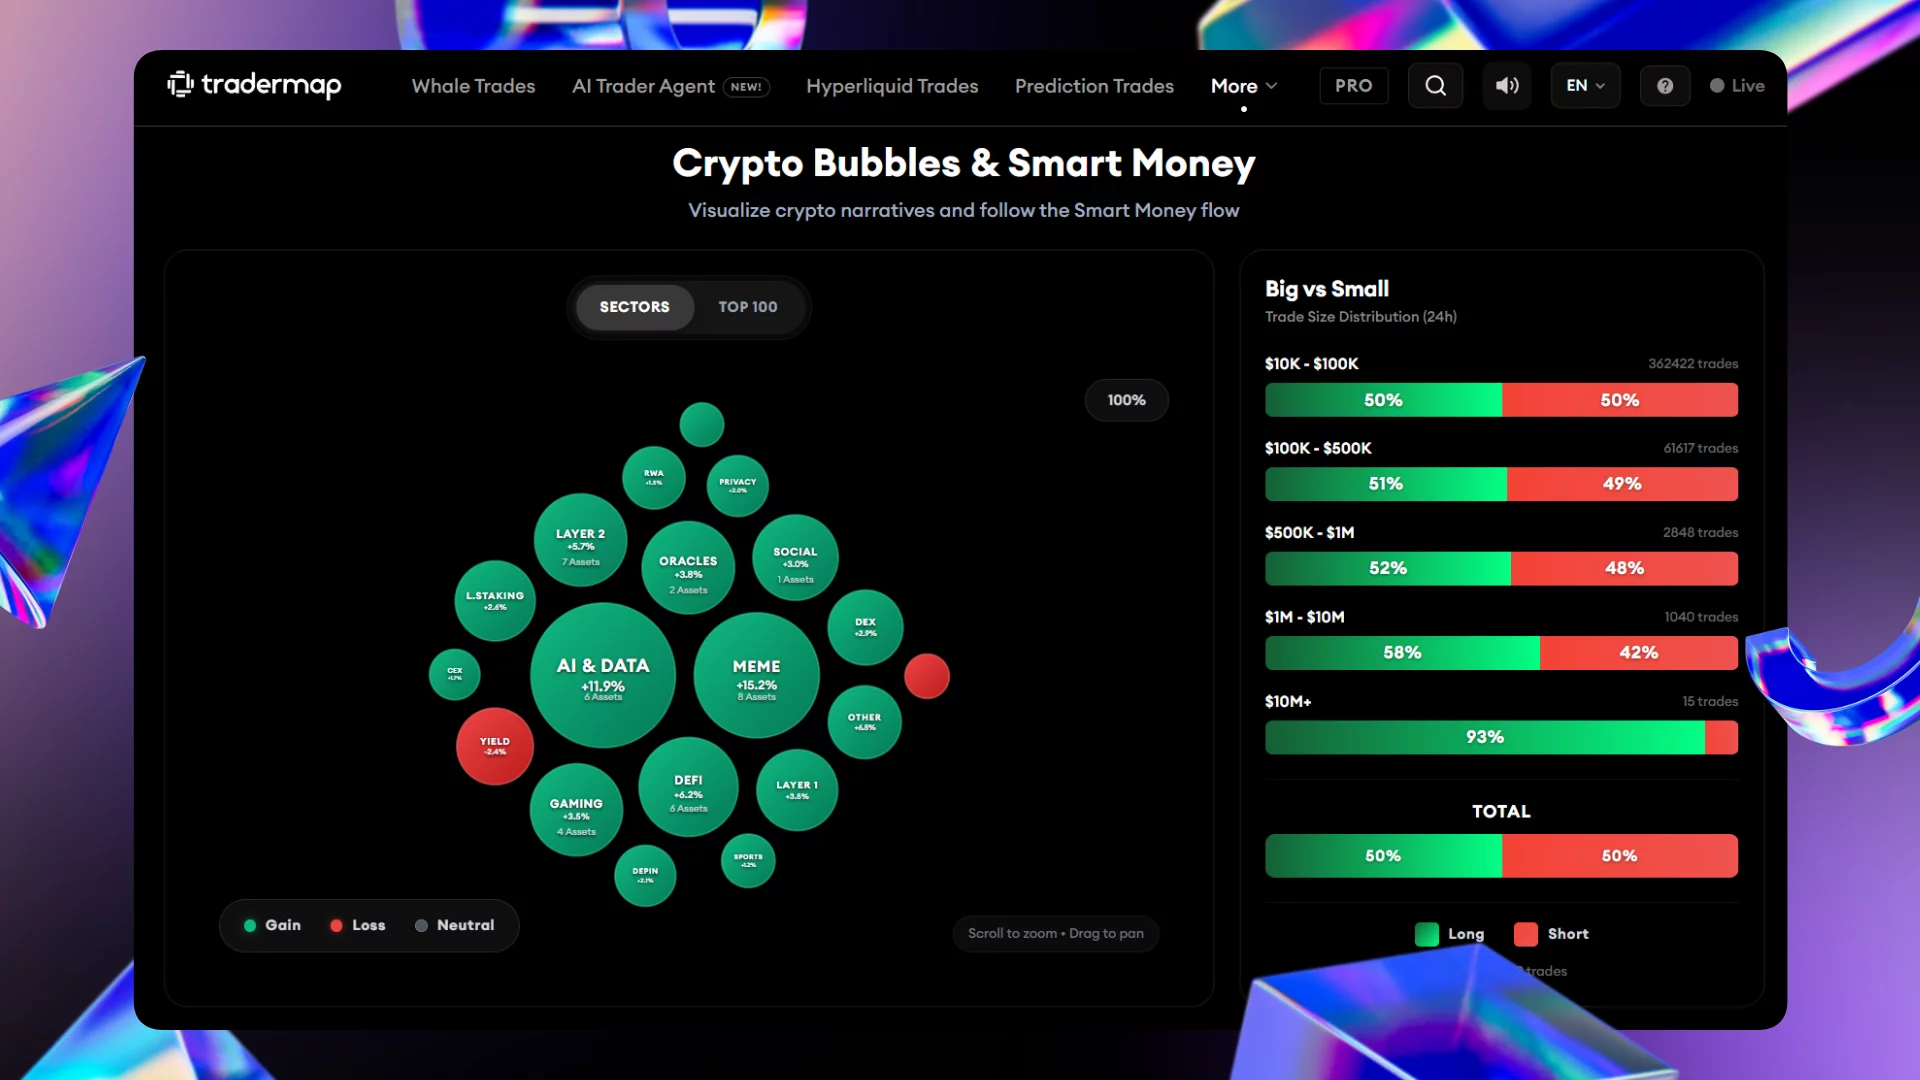
Step 3: Correlate with visual momentum
Use the RSI Heatmap and Crypto Bubbles to see which assets are overextended. If a whale makes a massive entry on an asset that the dashboard shows is overbought or oversold, that’s a high-probability trade signal.
4. The strategic benefits of whale trading
Adopting a whale-centric strategy provides several unique advantages that standard technical analysis cannot offer:
- Liquidation Hunting: By tracking real-time Liquidations, users can see exactly where leverage is being “flushed out”. Smart Money often enters at these points of maximum pain for retail traders.
- Contextual Execution: TraderMap integrates a live news feed alongside trade data. This allows users to understand the “why” behind a whale movement, such as an SEC decision, ensuring they aren’t trading in a vacuum.
- Big vs. Small Analysis: Use the Big vs. Small distribution tool to distinguish between genuine institutional accumulation and speculative retail bubbles.
Conclusion: An edge in an uncertain market
In an industry where information is the ultimate currency, the ability to follow the “Smart Money” is the only way to operate with the clarity of a market veteran. TraderMap provides the institutional-grade tools necessary to turn raw blockchain data into actionable trading intelligence.
Stop guessing and start following the data. Explore the future of real-time crypto intelligence at tradermap.io.
Disclosure: This content is provided by a third party. Neither crypto.news nor the author of this article endorses any product mentioned on this page. Users should conduct their own research before taking any action related to the company.