Hyperliquid pulls back after parabolic rally, retesting key support zone


Hyperliquid is cooling off after a parabolic rally, with price pulling back from recent highs as traders watch key support levels.
Hyperliquid (HYPE) is trading at $34.25 at press time, down 5% over the past 24 hours. This follows a strong rally that saw the token climb 83% over the last 30 days, peaking at a new all-time high of $39.58 on May 26. Despite the dip, trading activity remains high. In the last 24 hours, trading volume rose to $325.7 million, a 12% increase in the past day.
Derivatives activity has also been sustained, with a daily volume of $1.27 billion, up 8.33%, according to Coinglass data. Following the recent price peak, HYPE’s open interest dropped 4.45% to $1.29 billion, indicating that some traders might be taking profits or reducing leverage.
The recent market move comes after Hyperliquid’s decentralized perpetuals platform saw a record spike in on-chain metrics. For the week ending May 26, the decentralized exchange recorded the highest weekly trading volume of $72 billion and an all-time high in open interest at $10.1 billion.
Hyperliquid also surpassed major decentralized finance platforms like Berachain (BERA) in total value locked, reaching $3.5 billion, and now nears $1.5 trillion in cumulative trading volume less than two years after launch.
Part of the platform’s recent spotlight stems from visible high-leverage whale activity. Notably, pseudonymous trader James Wynn opened a $1.25 billion long position on Bitcoin (BTC) using 40x leverage between May 21–22.
Initially, the trade netted in unrealized gains of $40 million, but by May 25, a market decline brought on by Trump’s tariff announcement resulted in losses ranging from $13.4 million to $17.5 million.
Looking at the technical picture, HYPE appears to be in a healthy consolidation phase. After retreating from the upper Bollinger Band at $39, the token is currently testing the middle band, which is in line with short-term moving averages, around $33.
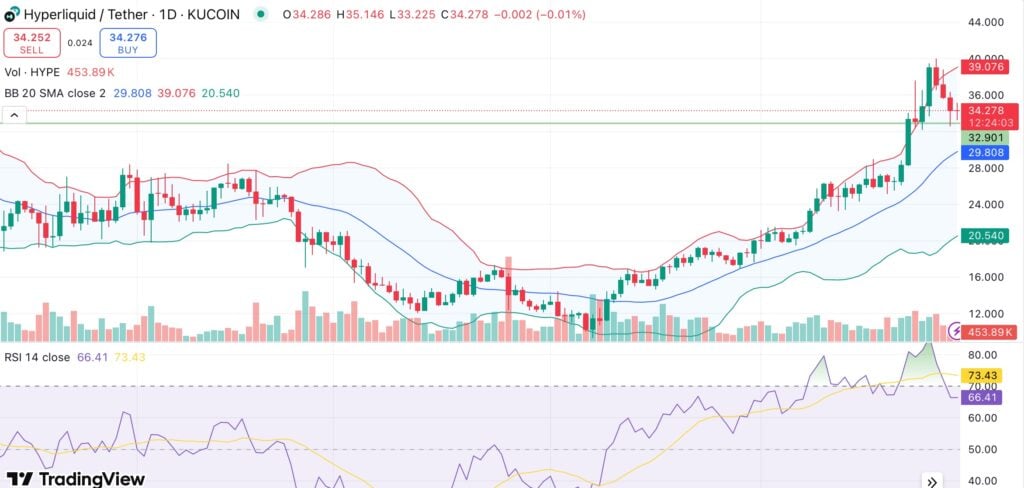
At 65.5, the relative strength index is showing positive momentum despite declining from overbought levels. The moving average convergence divergence is still bullish and indicates a sustained upward bias. All major moving averages, including the 10-day, 100-day, and SMAs, are in strong buy territory.
The Stochastic RSI, on the other hand, is cooling, indicating that the rally may be losing steam. Bulls may view this as a buying opportunity if the token remains above the 20-day EMA at about $30.4. A drop below this could lead to a retest of lower levels near $28. On the upside, a break above $36 might pave the way for a second push toward $40 and higher highs.