Is the Fed signaling a market crash? Why the 50 bps rate cut feels like 2007 all over again


Why did the Fed cut rates by 50 bps, the largest since 2020? What hidden dangers are they trying to prevent, and could this backfire on the economy?
Table of Contents
Fed drops a “bomb”
On Sep. 18, the U.S. Federal Reserve made a move that turned heads across the financial world—it slashed its benchmark interest rate by 50 basis points (bps), marking the first cut since the pandemic hit in March 2020.
This adjustment brought the rate down to a range of 4.75% to 5%, a larger drop than many analysts had expected. For context, the rate had previously been at a 23-year high, hovering between 5.25% and 5.50%.
The Fed’s decision comes right after some positive news on the inflation front. In August, U.S. consumer price inflation dropped to its lowest point since February 2021, settling at 2.5% — slightly below the forecasted 2.6%.
However, core inflation, which strips out food and energy prices, rose by 0.3%, showing that underlying pressures are still present. At the same time, job gains have slowed, and while the unemployment rate has inched up, it remains relatively low.
In its press release, the Federal Open Market Committee reiterated its commitment to bringing inflation down to 2%, signaling a potential shift toward a prolonged period of easing. This comes especially in light of the fact that U.S. inflation once soared to a staggering 9.1% in June 2022 under the Biden-Harris administration.
The question now is: what does this mean for the crypto market? Will this easing pump liquidity into the market and boost crypto prices, or will uncertainty keep investors cautious?
Stocks and crypto in green
Following the Fed’s unexpected rate cut, the stock market initially experienced mixed sentiment. On Sep. 18, the outsized 50 basis point cut was cheered by traders, with major indices like the Dow Jones and S&P 500 trading in the green.
However, by the end of that trading session, optimism faded. Stocks ended up in the red, signaling growing concerns that the Fed might be acting to brace for potential economic weakness.
On Sep. 18, the Dow Jones Industrial Average slid 103 points, or 0.25%, closing at 41,503. Earlier in the session, it had surged by over 375 points before retreating. The S&P 500 lost 0.29% to settle at 5,618, while the Nasdaq Composite dropped 0.31% to 17,573.30.
But as of Sep. 19, the markets have welcomed the rate cut with open arms. At the time of this writing, the trading session is still ongoing, and the indexes have surged dramatically.
The Nasdaq is up 476 points, gaining over 2.7% and reaching a high of 18,050, while the S&P 500 has risen 93 points, gaining over 1.66%, and now sits at 5,711.
Meanwhile, the crypto market has also turned bullish. The total market cap has increased by nearly 6.5% in the last 24 hours, reaching $2.18 trillion.
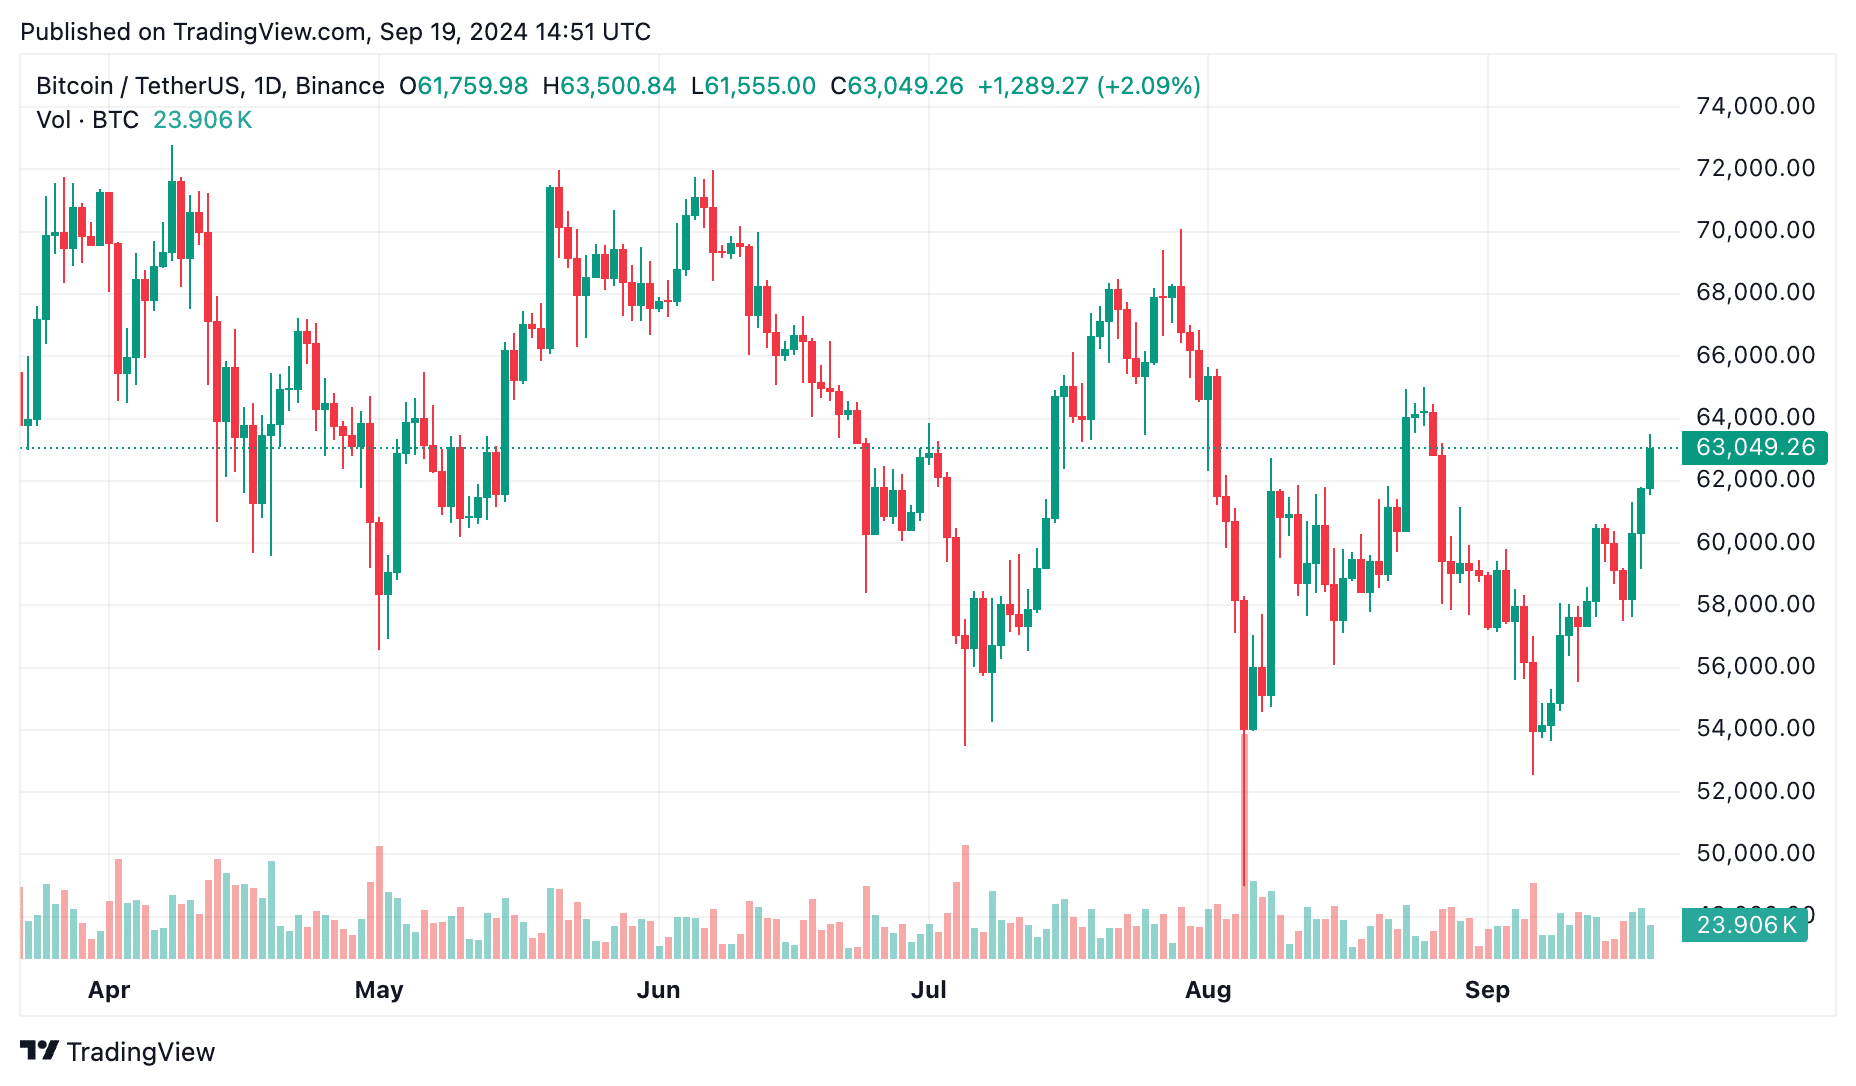
This marks a sharp reversal from earlier concerns. On Sep. 18, Bitcoin (BTC) broke through the $62,000 resistance mark, a level it had failed to cross since late August. Back then, BTC had been trading around $64,000 before dipping as low as $54,000 by September 9.
Now, BTC is regaining momentum with a strong upward push, gaining over 6.5% in the last 24 hours and trading at $63,500 at the time of writing. Ethereum (ETH) is also climbing, currently at $2,430, up by more than 6%.
Altcoins within the top 100 are seeing substantial gains, with increases ranging between 15% and 30%, making this one of the largest single-day jumps in recent weeks.
Looming concerns surrounding the financial markets
The recent 50 bps rate cut by the Fed has sparked serious concerns across the financial community. One perspective came from The Kobeissi Letter, a well-regarded financial newsletter that has drawn alarming parallels between this rate cut and those from the past.
In their X thread, they pointed out that this is only the third time in recent history that the Fed has begun a rate-cut cycle with such a large reduction, a move that should raise eyebrows.
According to The Kobeissi Letter, the last two times the Fed made such an aggressive cut were in 2001 and 2007. In both instances, the economy didn’t just wobble — it crashed.
“In 2001, when the Fed started with a 50 bps rate cut, Nasdaq returns totaled -76% from top to bottom over a 3-year period.”
In simpler terms, technology stocks tanked, marking one of the worst bear markets in history.
Things didn’t fare much better in 2007 when the Fed’s rate cuts coincided with the global financial crisis. The Nasdaq again dropped by a staggering 56% from its peak, causing widespread devastation in the tech sector and beyond.
Now, fast forward to 2024. We’re in a very different world—tech stocks are at all-time highs, and the Nasdaq has surged. Yet, The Kobeissi Letter raises a critical question: “Clearly, 2024 is much different from 2001 and 2007, so why is the Fed cutting rates so aggressively?”
Their concern lies in the fact that history has not been kind when the Fed starts a rate-cut cycle with such a large reduction. In both previous instances, these moves were followed by deep recessions, market crashes, and widespread economic fallout.
So, what about 2024? On the surface, the economy seems relatively strong. Job gains may have slowed, and unemployment has ticked up slightly, but it’s still at historically low levels. Inflation is easing, too—down to 2.5% in August, the lowest since February 2021.
But beneath the surface, there may be more lurking. The Fed’s aggressive rate cut could indicate that they see risks the broader market has yet to fully acknowledge.
Perhaps they’re bracing for a slowdown in economic growth or trying to cushion the blow from higher debt levels, which have been steadily rising as borrowing costs soared during the recent period of tightening.
It’s also worth noting that the stock market reacted with mixed signals. Initially, traders welcomed the rate cut, sending the Dow and S&P 500 to new highs. But by the end of the day, reality set in, and both indices closed lower. The next few months will be crucial in determining whether we’re in for a rough ride, or if this time really will break the cycle.