Is this the end of Bitcoin’s bull run — or just a healthy correction?


Bitcoin reached a new all-time high of $109,114 on January 20. However, instead of fueling hopes of further gains, it has faced persistent sell pressure, dropping about 20% from the peak as of this writing. Recent weeks have seen weak demand, fading accumulation, and rising fear among short-term investors.
At Outset PR, we observe that such corrections are not uncommon in Bitcoin’s historical cycles, often driven by shifts in liquidity, derivatives market positioning, and investor sentiment. Below, I’ll look into the ongoing Bitcoin liquidity trends, derivatives market activity, and holder cohorts’ behavior to see whether the original cryptocurrency has already peaked for this cycle or is going through a temporary correction.
Table of Contents
From distribution to potential accumulation
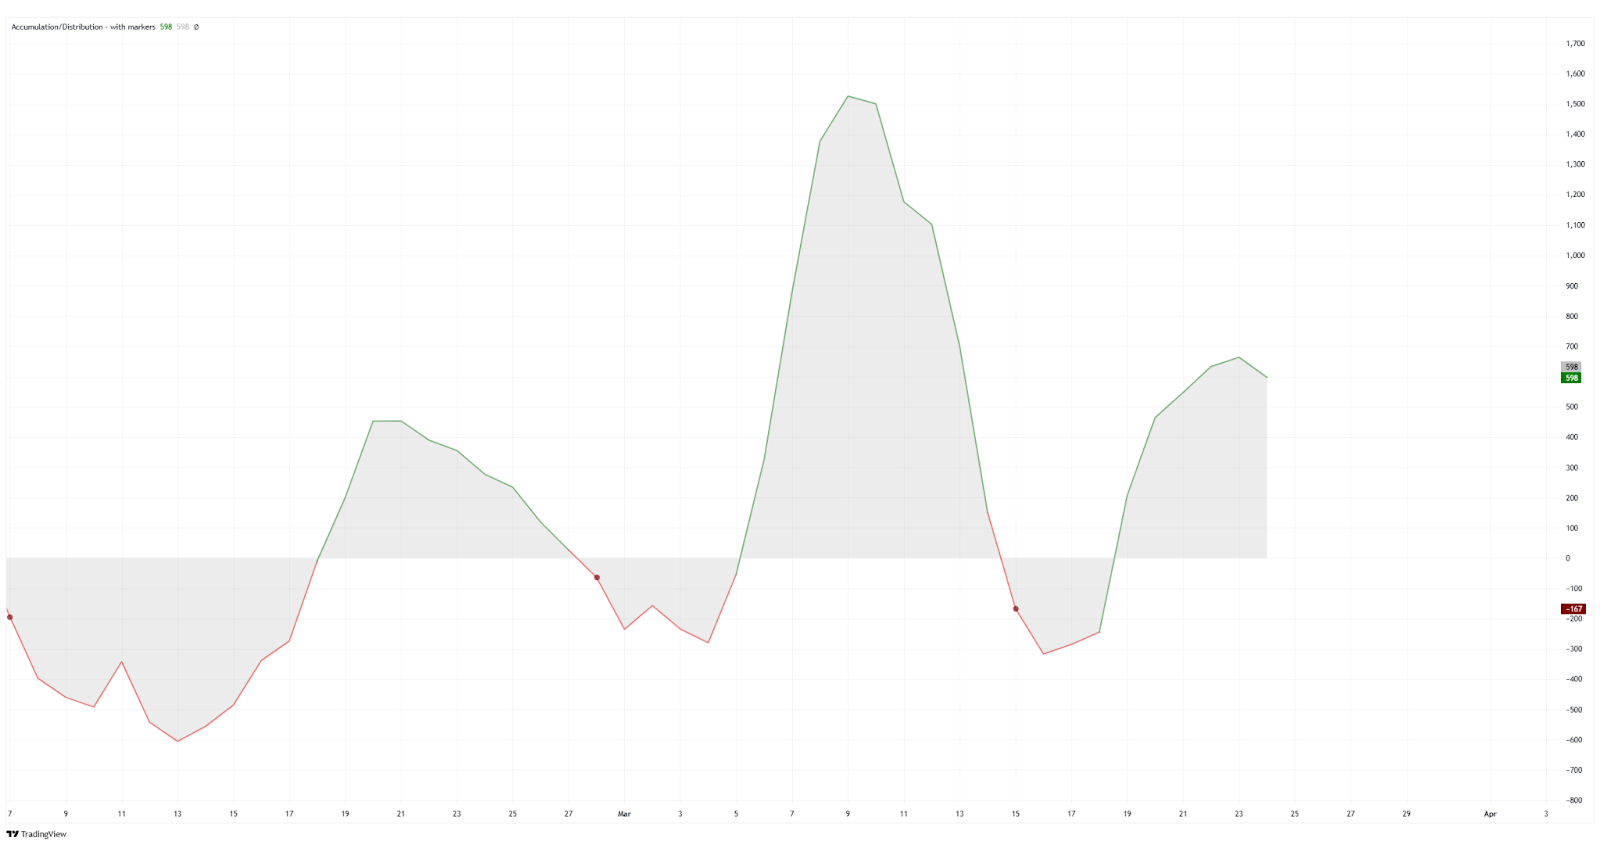
Bitcoin’s market cycles are driven by phases of accumulation and distribution. While a clear distribution phase emerged in late February 2025, recent movements in the Accumulation/Distribution (A/D) Indicator reveal a strong cycle of accumulation followed by intense selling pressure over the past few weeks.
After hitting its lowest point in mid-March, the indicator is now rebounding, suggesting that accumulation is resuming. Historically, such rebounds in the A/D Indicator have often preceded periods of price stabilization or recovery. However, whether this marks the beginning of a sustained accumulation phase or just a temporary bounce remains to be seen.
Further confirming this trend, spot trading volumes on centralized exchanges dropped by 19.9%, and derivatives trading volumes declined by 20.9%, according to the February 2025 CoinDesk Data’s Exchange Review. Additionally, open interest on derivatives exchanges fell by 29.8%, the lowest since November 2024.
The situation worsened after the Bybit hack, which resulted in a $1.4 billion loss, amplifying sell pressure and discouraging accumulation as liquidity concerns and market uncertainty intensified.
Contracting liquidity limits Bitcoin’s upside
Persistent liquidity contraction — typical of market behavior during corrections — is one of the major causes of Bitcoin’s difficulty in reaching new highs. According to Glassnode data, net capital inflows into Bitcoin have stalled, with the Realized Cap growing at just +0.67% per month. This means the market lacks the necessary influx of fresh capital, hindering price increases.
Additionally, Hot Supply — a key indicator of active trading liquidity — has declined from 5.9% to 2.8%, a drop of more than 50%. Exchange inflows have also fallen by 54%, further reinforcing that trading activity is slowing and demand-side pressure is weakening
On the derivatives side, open interest in Bitcoin futures has fallen from $57 billion at ATH to $37 billion (-35%), showing reduced speculative interest and hedging activity.
Glassnode data also shows that the 30-day rolling sum of short-term holder losses has reached $7 billion, marking the largest sustained loss-taking event of the cycle, yet remaining less severe than the May 2021 crash and the 2022 bear market.
UTXO age data reveals strong holder conviction
CryptoQuant’s Realized Cap – UTXO Age Bands, which tracks the USD value of coins by age since last moved, shows that a significant share of Bitcoin’s realized cap is held by long-term investors.
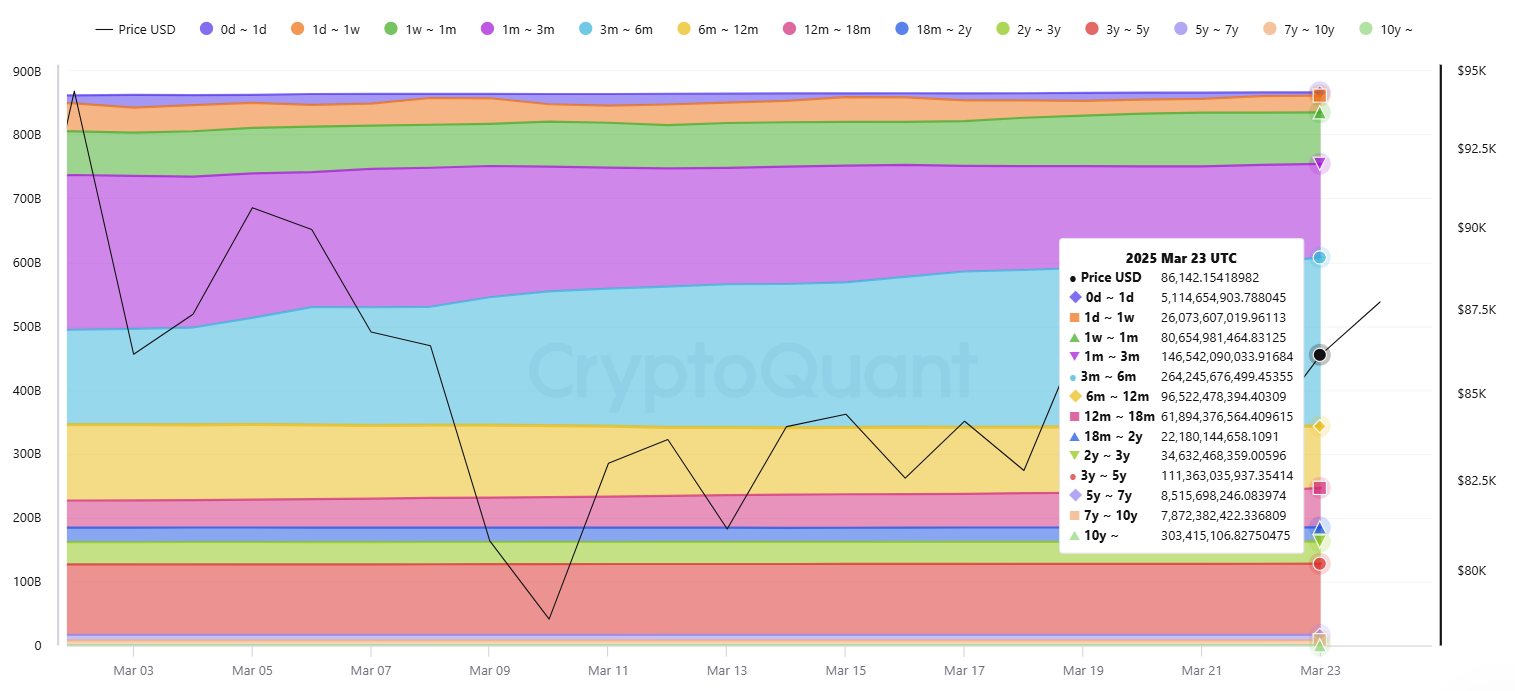
A breakdown of the realized cap across age cohorts as of March 23, 2025, shows the following:
- 0–1 day: $5.1 billion
- 1 day–1 week: $26.1 billion
- 1 week–1 month: $80.7 billion
- 1–3 months: $146.5 billion
- 3–6 months: $264.2 billion
- 6–12 months: $96.5 billion
- 12–18 months: $61.9 billion
- 18 months–2 years: $22.2 billion
- 2–3 years: $34.6 billion
- 3–5 years: $111.4 billion
- 5–7 years: $8.5 billion
- 7–10 years: $7.9 billion
- Over 10 years: $303.4 billion
We can see that UTXOs in the under one-week range total $31.2 billion, accounting for just 2.7% of the total realized cap. This indicates that while short-term trading exists, it is not the primary force driving the market. The low proportion of newly moved coins suggests that most recent buyers are still holding their positions, and many participants are not capitulating.
In contrast, the 3–6 month cohort now holds the largest share of Bitcoin’s realized cap at $264.2 billion. This cohort has remained largely unmoved through recent price swings, further reinforcing long-term conviction in the market.
Notably, Bitcoin, which has been held for over 10 years, represents $303.4 billion, the single largest realized value across all age bands.
Taken together, the current UTXO age distribution supports a bullish accumulation narrative, where long-term holders remain confident, speculative flipping is subdued, and overall supply continues to tighten—conditions that have historically laid the groundwork for strong price recoveries.
ETF flows and market impact
The latest ETF data from March 5-21, 2025, highlights mixed signals, with some ETFs experiencing strong inflows while others continue to face significant outflows, suggesting that while Bitcoin’s price action remains under pressure, long-term institutional interest is supporting market sentiment.
- IBIT (BlackRock’s Bitcoin ETF) recorded a total inflow of 39,774 BTC.
- FBTC (Fidelity’s Bitcoin ETF) saw an inflow of 11,392 BTC.
- ARKB (Ark Invest’s Bitcoin ETF) attracted 2,021 BTC, while BTCO (Invesco’s Bitcoin ETF) recorded 2,678 BTC in net inflows.
- GBTC (Grayscale’s Bitcoin Trust) continued to face outflows, losing 22,526 BTC.
- Bitcoin ETFs collectively added 36,138 BTC over this period, indicating that institutional demand remains in place.
Closing thoughts
Bitcoin is navigating a complex post-ATH environment, where a mix of short-term headwinds and long-term strength is clearly seen. Liquidity contraction is seen in both spot and derivatives markets as capital inflows slow and speculative activity declines. However, accumulation is rebounding, UTXO age data shows strong long-term holder conviction and low short-term selling, and institutional flows — despite volatility — continue to favor Bitcoin, with net inflows across several major ETFs. While price pressure persists, these underlying dynamics suggest the current phase may represent a healthy consolidation rather than the end of the current bull cycle.
Disclosure: This article does not represent investment advice. The content and materials featured on this page are for educational purposes only.