Jasmy price soars: Here’s why it may crash soon

Jasmy price continued its recent recovery this week, making it one of the best-performing tokens in the crypto industry.
- Jasmy price surged by double-digits this week.
- The supply of Jasmy tokens in exchanges has dived.
- However, it has formed a double-top pattern, pointing to a reversal.
JasmyCoin (JASMY), often dubbed Japan’s Bitcoin, rose by 11% on Friday. It was trading at $0.00917, up by nearly 70% from its lowest level in December.
Data compiled by CMC indicate that the volume increased by 15% over the last 24 hours to over $156 million. The soaring volume in the spot market also coincided with the performance in the derivatives market.
CoinGlass data shows that Jasmy’s futures open interest has been in a strong uptrend. It jumped to a high of $41.4 million, its highest level since Sep. 14 last year. It has soared sharply from the December low of less than $10 million.
There are signs that whales and retail traders have continued to accumulate JasmyCoin. Data compiled by Nansen shows that the top 100 holders have increased their positions by 92% in the last 90 days to over 41.59 billion.
This trend has coincided with the ongoing exchange outflows. CoinGlass data show that the supply of Jasmy on exchanges has declined from over 11.6 billion in January last year to a record low of 7.99 million.
The accumulation will likely continue after the Jasmy token was listed by Aster, a leading perpetual futures platform. Additionally, the developers have indicated major developments this year, including the launch of the Jasmy layer-2 mainnet and the expansion of the Base App platform.
Jasmy price forms double-top pattern
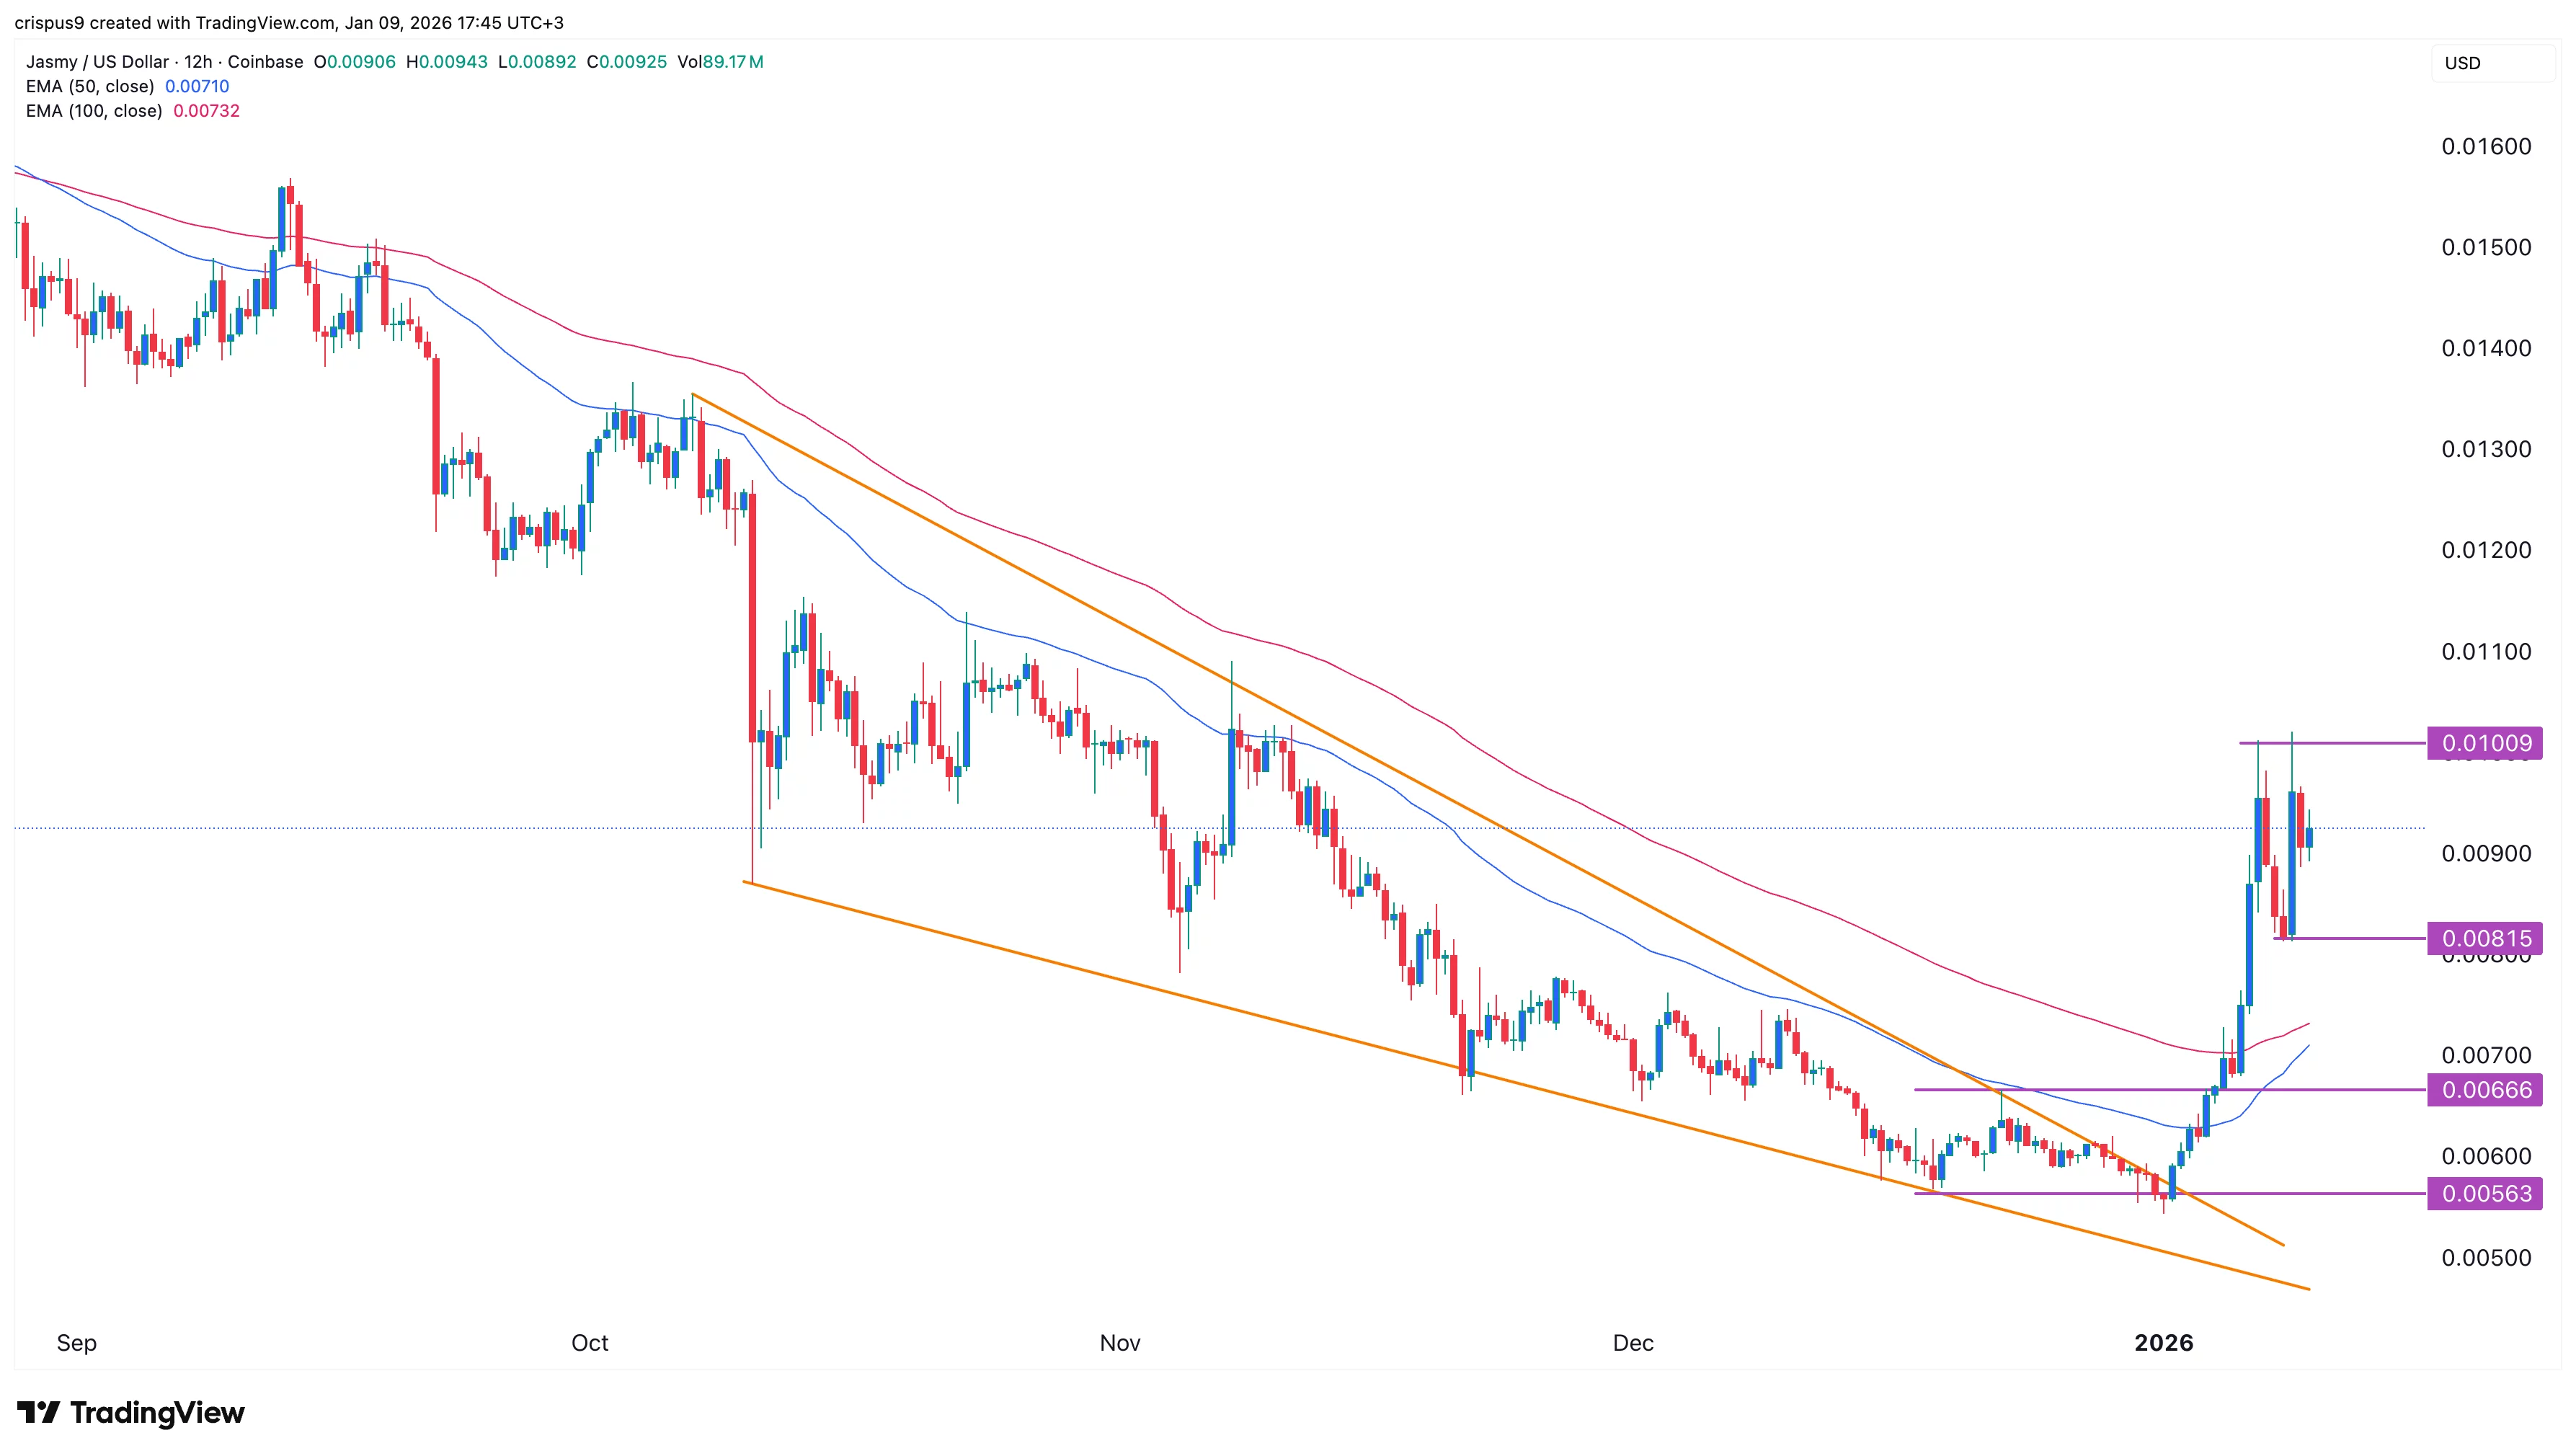
The daily chart shows that technicals contributed to the Jasmy price rebound. It formed a double-bottom pattern at $0.0056 and a neckline at $0.0066.
The coin also formed a falling wedge pattern, characterized by two descending, converging trendlines. It has now moved above the 50-day and 100-day moving averages, which is a positive sign.
However, the token has formed a double-top pattern at $0.010 and a neckline at $0.0081. Therefore, there is a risk that the coin will have a strong bearish breakout in the near term. If this happens, the initial target will be the neckline at $0.00815.