Understanding Bitcoin Price Charts: A Beginner’s Guide

Reading bitcoin charts is essential for traders who want to find the best market-timing opportunities in the crypto markets. In this guide, you will learn about the most common bitcoin price charts and how to read them, and you will discover the most popular technical indicators bitcoin traders use.
Information current as of September 2022.
Table of Contents
What Is a Bitcoin Price Chart?
A bitcoin chart is a visual representation of bitcoin’s historical price that shows price patterns that traders can use to identify bitcoin trading opportunities.
A bitcoin chart has a horizontal and vertical axis that shows the corresponding timeframe and price of the digital asset. Bitcoin price movements can be discerned by examining bitcoin charts with several timeframes, from minutes, hours, days, weeks, months, to years. Bitcoin charts are used by traders and analysts to attempt to identify price trends to capitalize on.
How to Read Bitcoin Price Charts
Learning how to read bitcoin charts is vital for anyone, who is looking to trade the digital currency. For you to study price movements or trends from a bitcoin chart, you must first understand the different types of charts.
The three most common charts used by traders are line charts, bar charts, and candlestick charts. Let’s take a look at them.
Line Chart
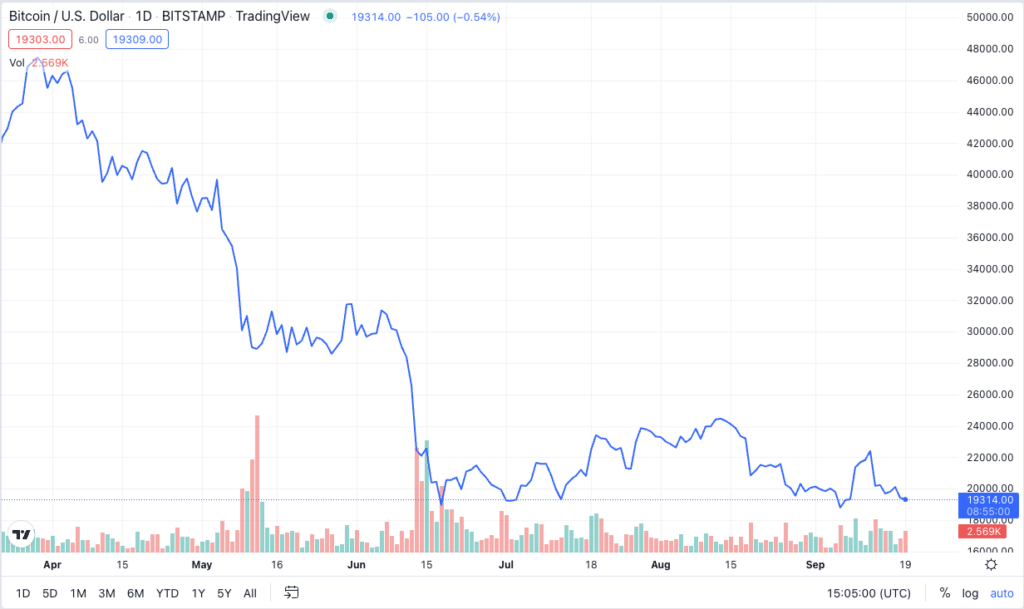
A line chart is a visual representation of an asset’s historical price activity depicted by a continuous line that shows the asset’s closing price. In this chart, the horizontal (x) axis is the time scale, and the vertical (y) axis shows the price.
In a line chart, you can deduce the price of bitcoin by linking a data point to the (x) axis in a straight line and the date by linking a data point to the (y) axis. Remember, each point in the line traces the daily (or weekly or monthly) closing price of bitcoin.
Bar Chart
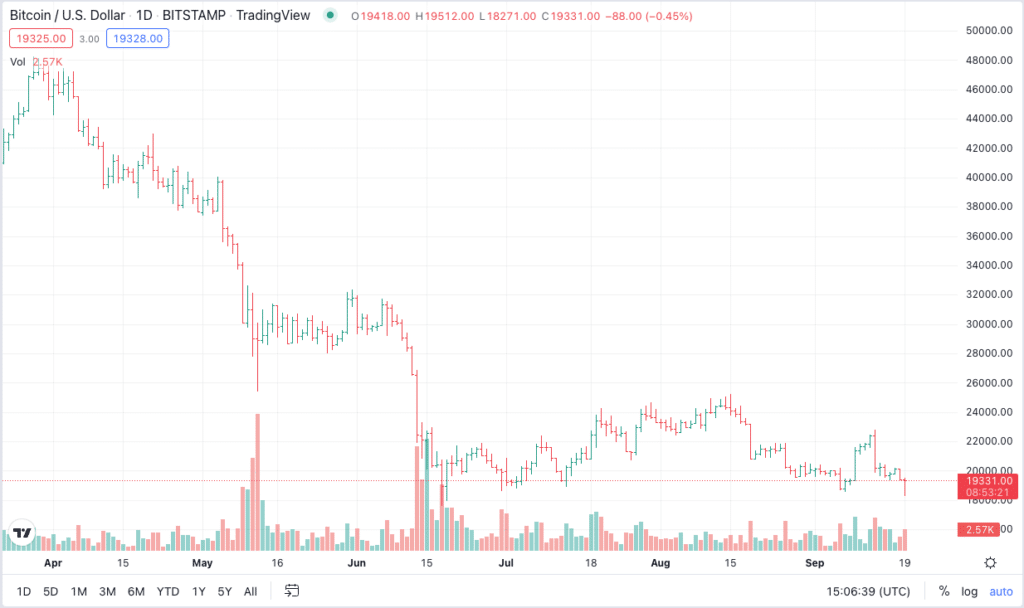
A bar chart is useful in tracking an asset’s daily price fluctuations and is indicated by the vertical length of a bar. The horizontal lines show the daily opening and closing bitcoin prices. A bar chart goes further than a line chart, not only showing price fluctuations but also the range of price movements and opening and closing prices.
Candlestick Chart
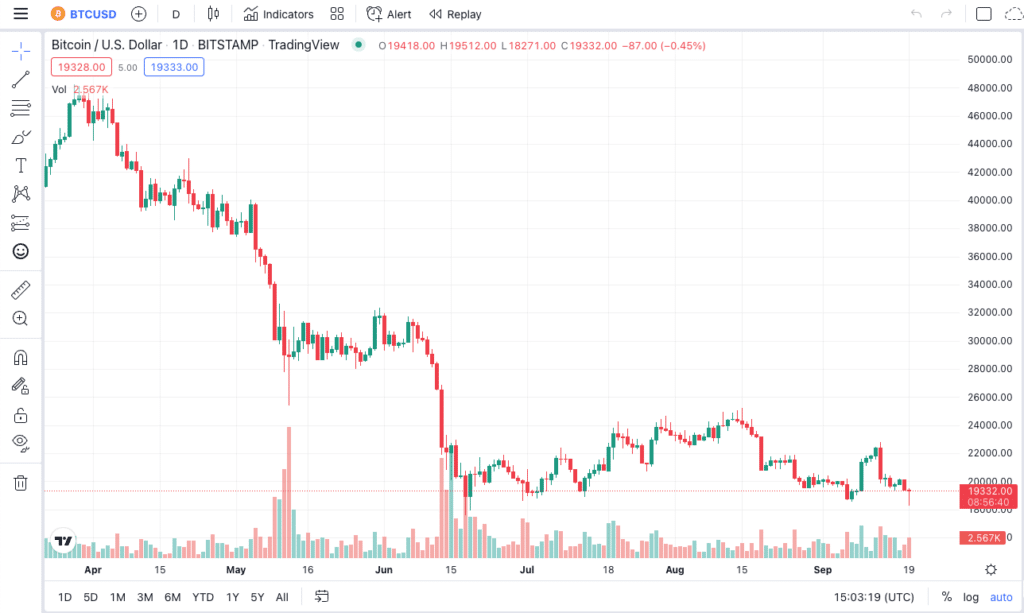
The most popular bitcoin chart out there is a candlestick chart. A candlestick chart uses candles to illustrate the price movement of bitcoin within a specific time frame. For instance, if a bitcoin chart is set to a 4-hour interval, then each candlestick denotes 4 hours of trading.
A candlestick is composed of a body and a wick. The body represents its opening and closing prices, with the wick attached to the summit representing the maximum price of the digital currency during the period. The wick attached to the base represents the minimum price of the asset within the chosen time frame.
A red candle signifies the price of bitcoin has declined, whereas a green candle shows the price has appreciated. Having said that, candlestick charts form different patterns, and it’s up to you as a trader to take a position depending on the shape, size, and color of the candlesticks.
A hammer candle pattern may tell us that the digital currency is nearing the bottom of a downtrend. The body of the candle is short, which represents the hammer, while the lengthy wick signifies sellers are driving the prices low during a certain trading period. It is known as a bullish reversal pattern that is supposed to indicate that once bitcoin bottoms out, buyers might create purchasing pressure, which would drive the price upwards.
A shooting star candle is used to describe a pattern that happens at the height of a rally before a reversal kicks in and the price starts to trend down. It is also known as a bearish reversal pattern. This formation is represented by a candle with a long upper wick and a small body.
Top Bitcoin Chart Analysis Indicators
Now, let’s take a look at some of the most popular chart analysis indicators bitcoin traders like to use.
Bollinger Bands
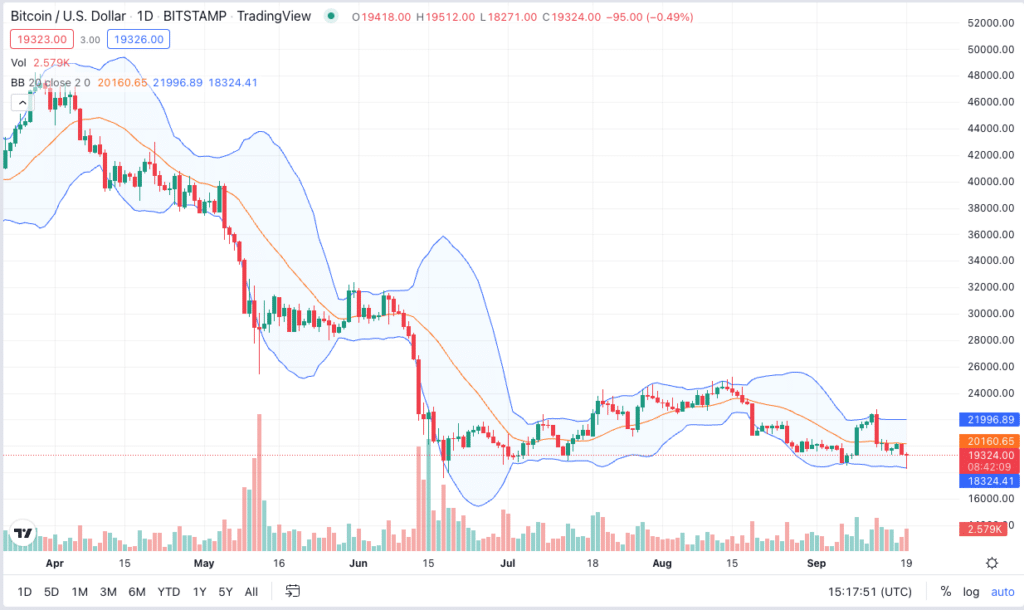
Bollinger Bands can help traders identify short-term movements in the price of bitcoin (BTC). The bands indicate periods of high and low volatility and are used together with other indicators. Bollinger band parameters can be adjusted to accommodate the highs and lows of bitcoin’s prices and the trader’s time preference.
When the price of bitcoin moves beyond the upper band, it’s considered overbought. Does it move below the lower band instead, the cryptocurrency is considered to be oversold.
RSI
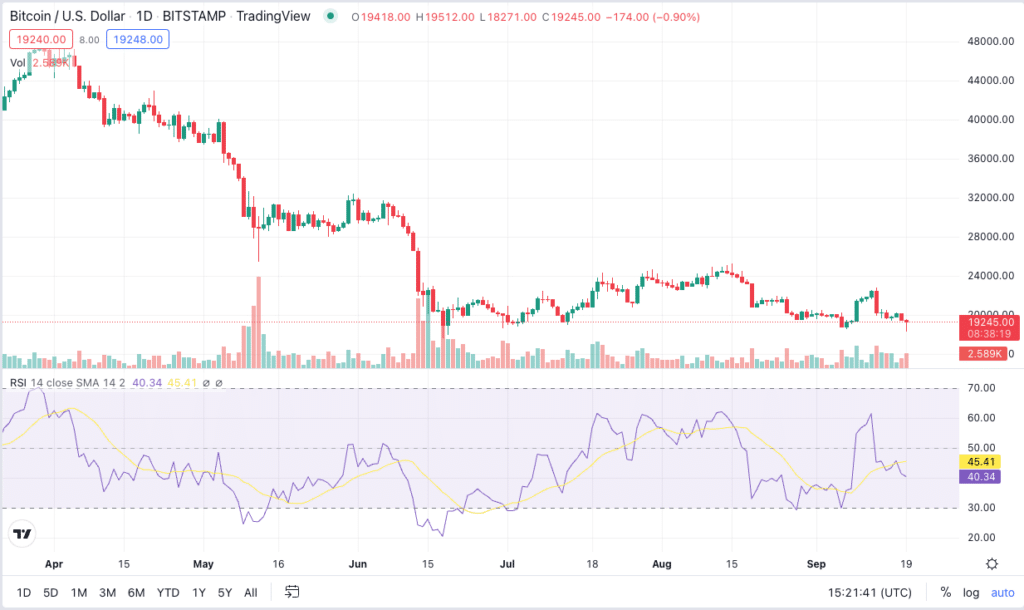
The Relative Strength Index (RSI) is a momentum indicator that measures whether a digital asset is being over-purchased or oversold. The index is represented as a line between two opposites and can range from 0 to 100.
The index commonly uses a 14-day time interval for a digital asset to be considered oversold when its value declines to 30 and overbought when its value appreciates to 70. To put it in another way, if the line moves up, (overbought), then the price may soon drop, but if the line moves down (oversold), the price may soon rise.
MACD
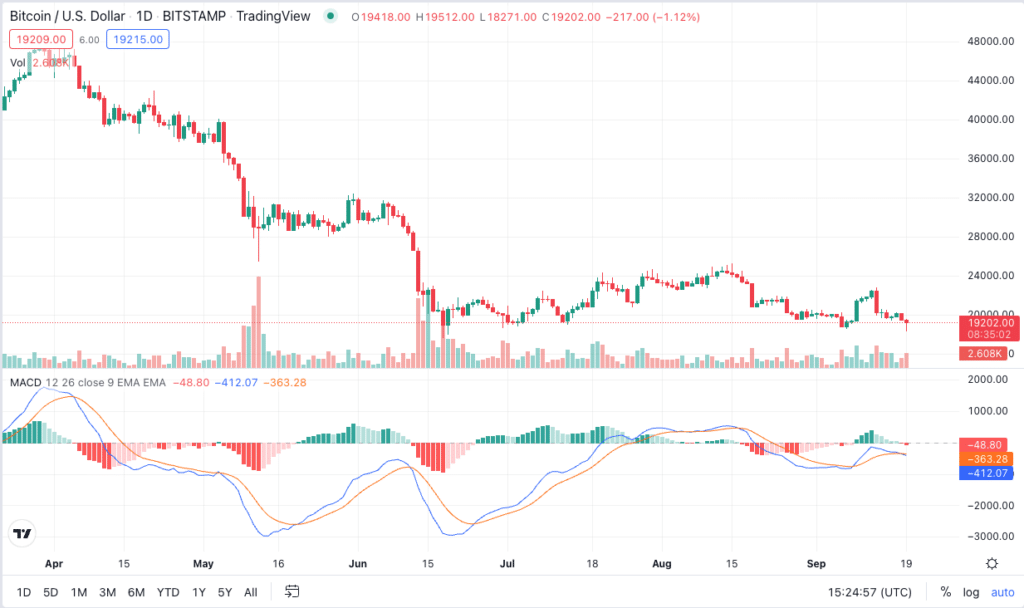
Moving Average Convergence Divergence (MACD) is a trend-following momentum indicator that aims to offer insights into the future price of an asset based on price movements.
MACD is comprised of three numbers. The first number denotes the number of periods used to calculate a faster-moving average. The second indicates the periods used to calculate a slower-moving average. The final number represents the number of bars used to compute the average of the amount by which the results of the first two numbers differ.
The intersection of the faster-moving average and the slower-moving average is known as a convergence. On the other hand, the scenario where the faster-moving average deviates from the slower-moving average is known as a divergence.
Movements in the MACD indicator can show overbought and oversold levels and possible trend reversals.
Is Technical Analysis a Good Approach to Investing in Bitcoin?
Technical analysis involves taking bitcoin’s past trading patterns and price volatility in an attempt to determine where the market will go next. It operates under the assumption that the market is fully efficient when pricing an asset. All past and present information are considered to provide the basis of bitcoin’s current value.
However, no chart indicator or technical analysis strategy can accurate determine where the price will go next. Purely focused on charts is, therefore, probably not a good approach to investing in bitcoin. Also, technical analysis is more of a short-term trading tool than a long-term investment approach.
As a result, most traders typically use chart analysis to identify entry and exit levels as opposed to as a standalone tool to make investment decisions.
FAQs
What Are Support and Resistance Lines?
Support and resistance lines are represented on a bitcoin price chart with the use of trendlines. A trendline is illustrated on a chart by linking a series of price data points. A support level is a point at which the price of a crypto asset stops falling due to a concentration of buying interest at that level. Resistance lines are drawn through several points where the price rises and sellers jump in, resulting in a state where the crypto asset struggles to go higher for the time being.
What is a Moving Average?
A moving average (MA) aims to ease out price volatility to spot a general trend. The idea is to plot multiple data points and average them out. The end value is then plotted on a graph. A trader can use MA’s and set them to any time interval they desire. Many traders believe though, that long-term MA’s are more useful as they carry more data.
Is Technical Analysis the Same for Stocks and Crypto?
Technical analysis can be applied to both stocks and crypto. The difference between stocks and the crypto market is that digital assets are generally more volatile.