Mantra is up 2,100% in 2024 as technicals point to more gains

Mantra, one of the best-performing altcoins in 2024, continued its strong rally, soaring to a two-month high.
Mantra (OM) jumped to $1.3155 as Bitcoin (BTC), Ethereum (ETH), and other altcoins retreated amid rising geopolitical tensions. It has rallied by over 2,130% this year.
Its rally has coincided with the ongoing rebound of its futures open interest, which has risen to a multi-month high of $30 million. A rising open interest signals that an asset has strong demand from investors.
There are three likely reasons for the ongoing surge. First, Mantra has hinted that it will launch its mainnet this month. While no date has been announced, it will likely happen on Oct. 23 during the Cosmoverse event in Dubai. In most cases, crypto companies launch big projects when there are significant events.
Mantra hopes that its mainnet will help it become the best network for developers in the Real World Asset tokenization industry. Analysts believe that the industry will promote fractional ownership of assets, increase liquidity, and boost transparency.
Mantra’s network will feature low transaction costs, a modular architecture, compliance and security features, and decentralization. As a Cosmos network, it will have access to the Inter Blockchain Communication protocol, facilitating asset transfers across blockchains.
Second, Mantra has soared because of its staking rewards, which are some of the highest in the industry. It has a staking yield of 22.32%, while its staking ratio is about 50%. The staking ratio is an important metric that examines the proportion of tokens in circulation that have been staked.
Mantra price has strong technicals

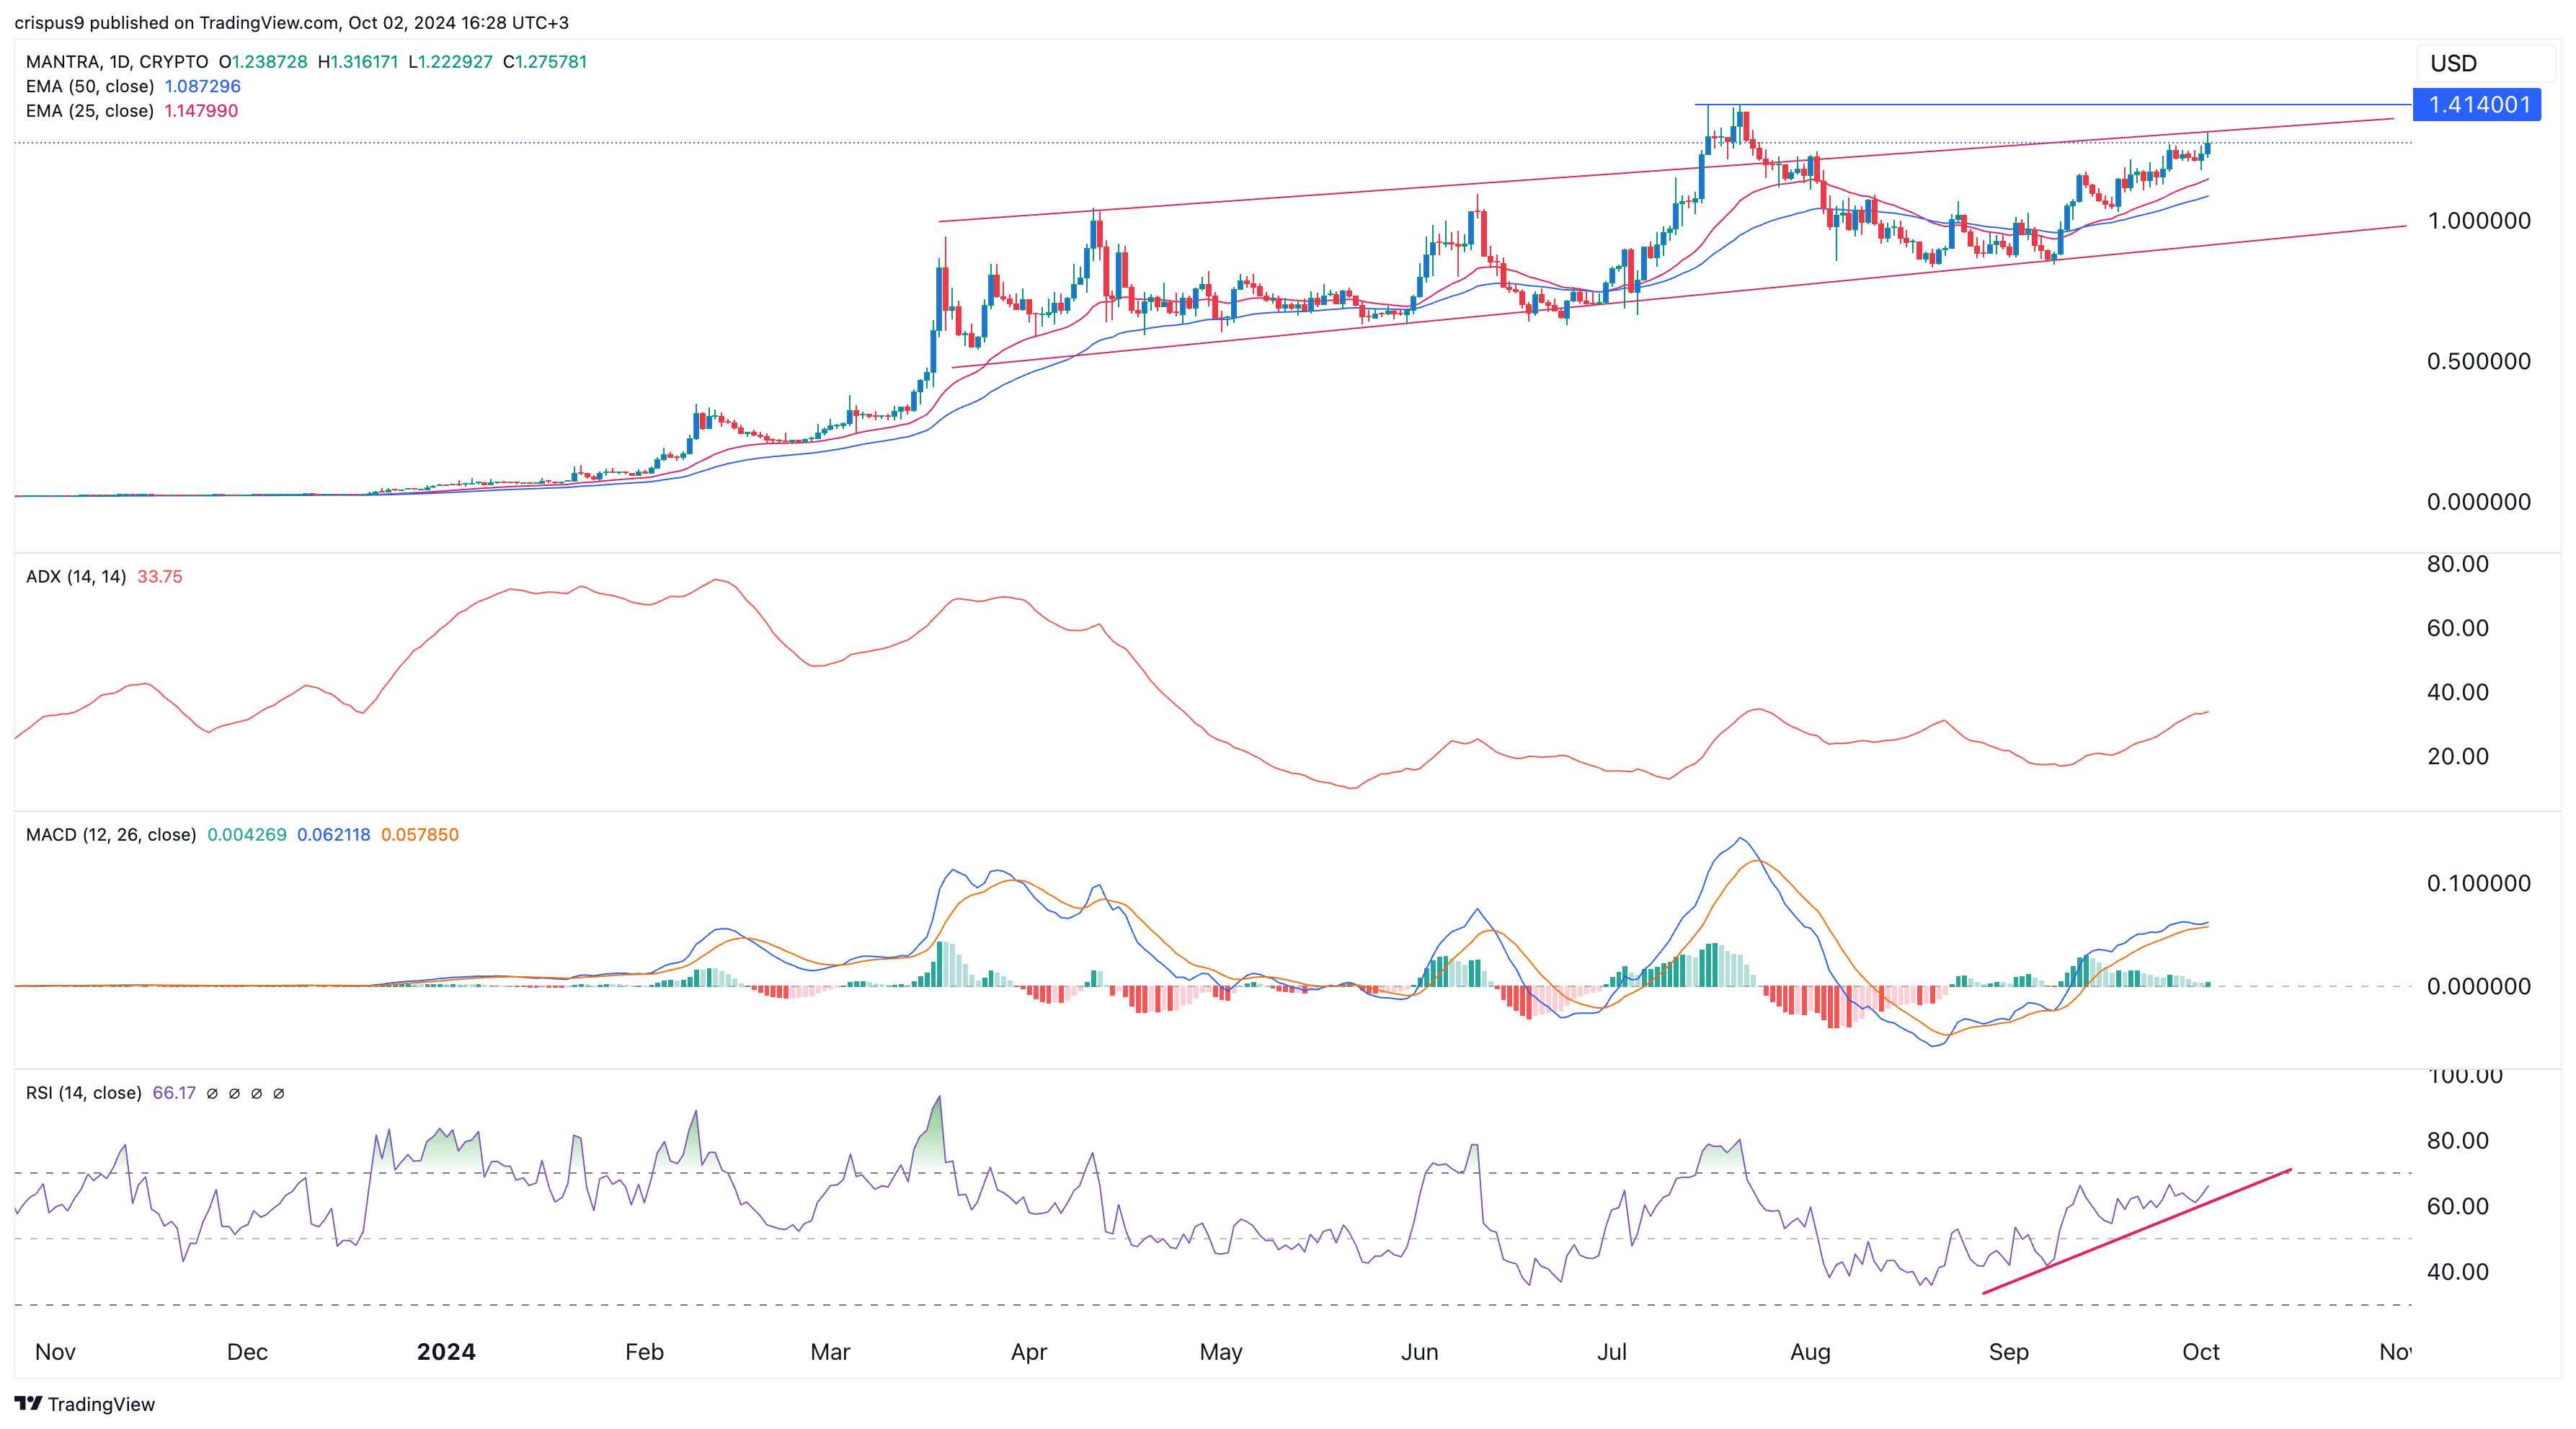
OM’s rally is also supported by its strong technicals. On the daily chart, the Relative Strength Index has been in a slow and steady rally since August when it bottomed at 36. It was approaching the overbought level of 70 on Oct. 2.
The Average Directional Index, a popular indicator that measures the strength of a trend, rose to 33. A trend is considered strong when it has moved above 25.
Additionally, the two lines of the MACD indicator have also rallied. Therefore, Mantra may continue rising, with the next reference level being $1.4140, its all-time high and 12% above the current level.


