MSTR stock forms a death cross pattern as enterprise mNAV turns negative


MSTR stock price rose by over 1% on Boxing Day as Bitcoin and other cryptocurrencies staged a cautious rebound.
- MicroStrategy’s shares jumped to $160, higher than this month’s low of $157. Still, the stock may be at risk of further downside.
- One reason for the loss of its premium is the ongoing Bitcoin (BTC) crash that has moved it from the year-to-date high of $126,200 to the current $88,800.
- Strategy’s stock price will likely continue to fall as sellers target the psychological threshold of $100.
MicroStrategy’s shares jumped to $160, higher than this month’s low of $157. Still, the stock may be at risk of further downside as the company’s enterprise value net asset value (mNAV) turned negative for the first time.
Data compiled by Bitcoin Treasuries showed that the mNAV dropped to 0.988. This occurred as its enterprise value fell to $59 billion, while the valuation of its Bitcoin holdings stood at $59.7 billion.
The basic market capitalization-based net asset value dropped to 0.763. These numbers mean that the premium that the company had a few months ago has disappeared.
One reason for the loss of its premium is the ongoing Bitcoin (BTC) crash that has moved it from the year-to-date high of $126,200 to the current $88,800. This decline has led to a sharp decline in the value of its Bitcoin holdings.
Another risk is that the company has continued to dilute its shareholders through its at-the-market offerings. In a regulatory filing, the company reported that it still has more than $11.8 billion remaining in its ATM offerings, indicating that further dilution is expected.
This dilution has brought its outstanding shares to over 267 million, up from 93.2 million in 2022.
The company may also remain under pressure as Bitcoin has formed bearish chart patterns, as we wrote in this prediction. It has formed a death cross and a bearish pennant on the daily chart. This means that the coin may drop to last month’s low of $80,000.
MSTR stock price technical analysis
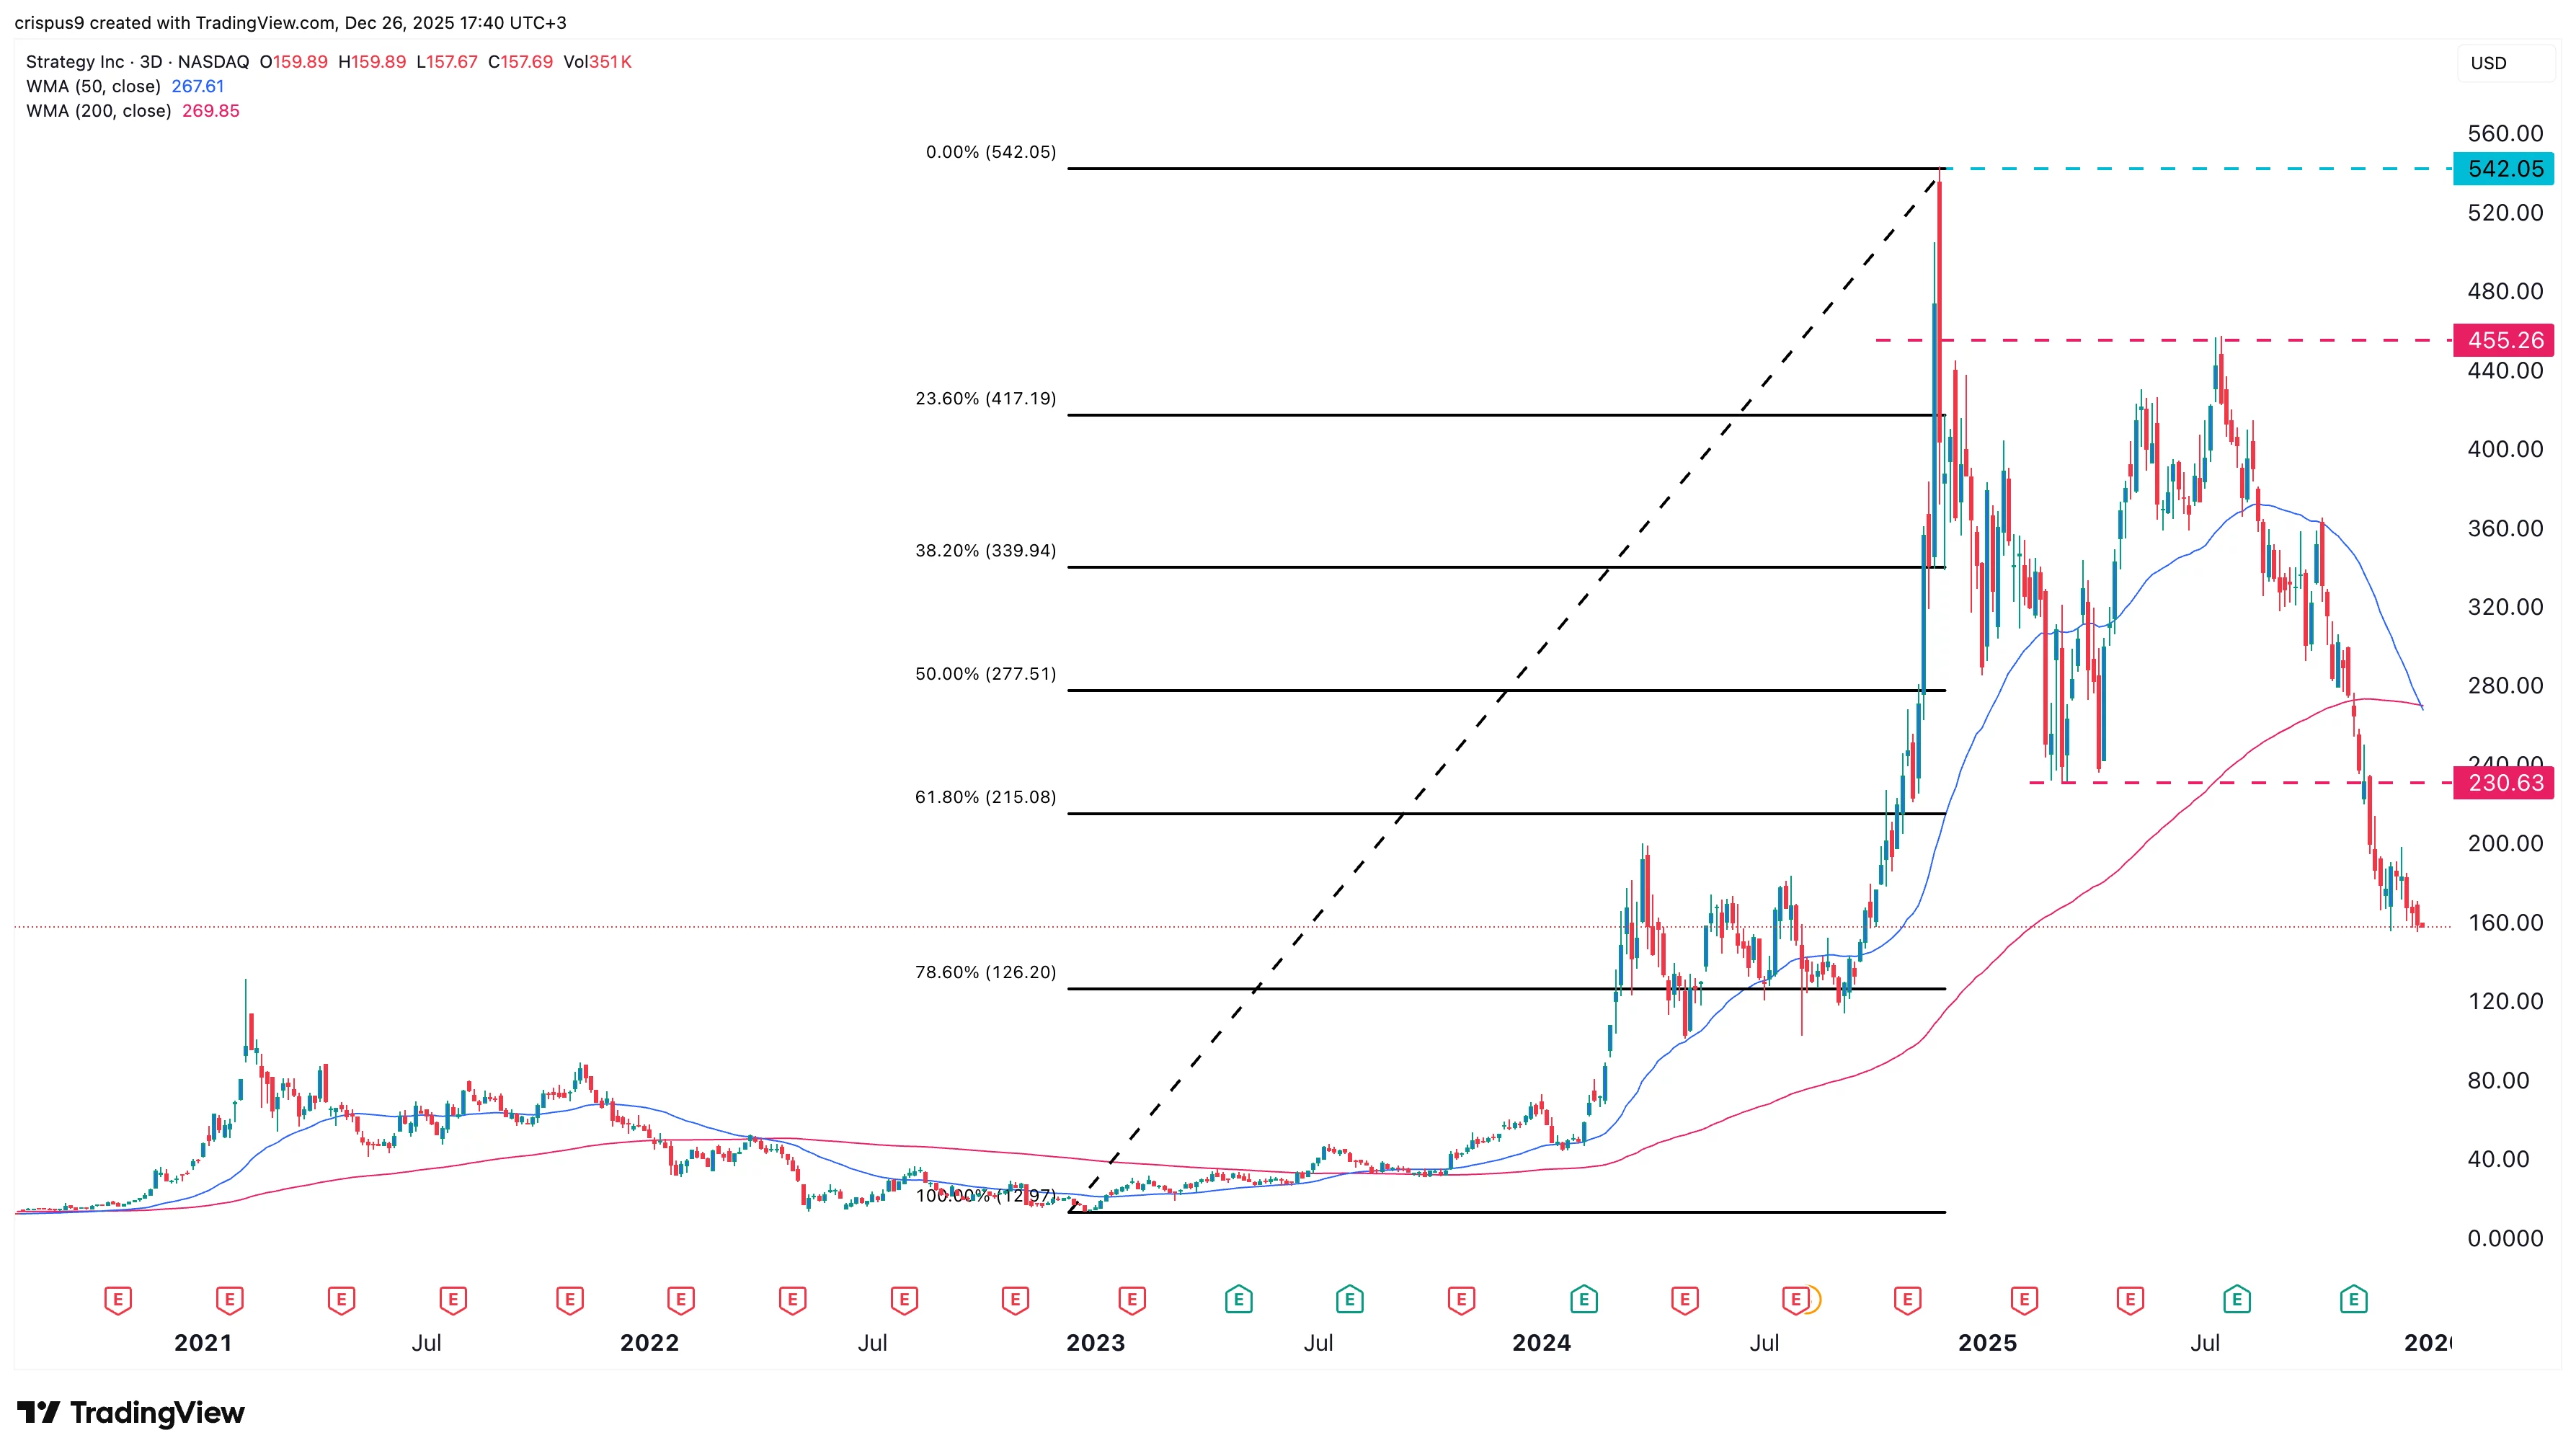
The three-day chart shows that the MSTR share price has been in a free fall in the past few months. It has now formed a death cross pattern as the 50-day and 200-day Weighted Moving Averages crossed each other.
The stock has moved below the important support at $230, its lowest level in March. It also plunged below the 61.8% Fibonacci Retracement level.
Therefore, the Strategy stock price will likely continue to fall as sellers target the psychological threshold of $100. This decline will be confirmed if it moves below the 78.6% Fibonacci Retracement level at $126.