MSTR stock eyes a big move as short interest jumps to 12.6%


The price of MSTR stock has remained within a narrow range since early February, closely tracking Bitcoin’s performance, which has stagnated between $60,000 and $70,000.
- MSTR stock price has formed a triangle pattern on the 12-hour chart.
- This pattern points to a big move in either direction.
- Strategy’s short interest has jumped to 12.6%.
Strategy stock was trading at $134 on Tuesday, up by nearly 30% from its lowest level in February. It remains substantially lower than its all-time high of $545.
Seeking Alpha data shows that more investors are shorting the company, hoping to benefit from its crash. The company’s short interest rose to 12.6%, much higher than last year’s low of 5%.
Short-sellers likely see the stock having numerous red flags. The first major one is the fact that Bitcoin (BTC) could be at risk of dropping to $50,000 in the coming weeks. It has formed a bearish pennant pattern, and the ongoing war in Iran has pushed investors to dump risk assets.
Additionally, while Strategy has continued to buy Bitcoin, it has done so by selling its common stock, a move that has led to substantial dilution. Its outstanding shares have jumped to over 310 million from less than 80 million a few years ago.
Strategy has also lost the premium it had a few years ago, with the net asset value falling below 1. At the same time, analysts have continued to pare back their estimates. Mizuho slashed the target from $403 to $320, while BTIG moved it from $630 to $250.
MSTR stock price chart analysis
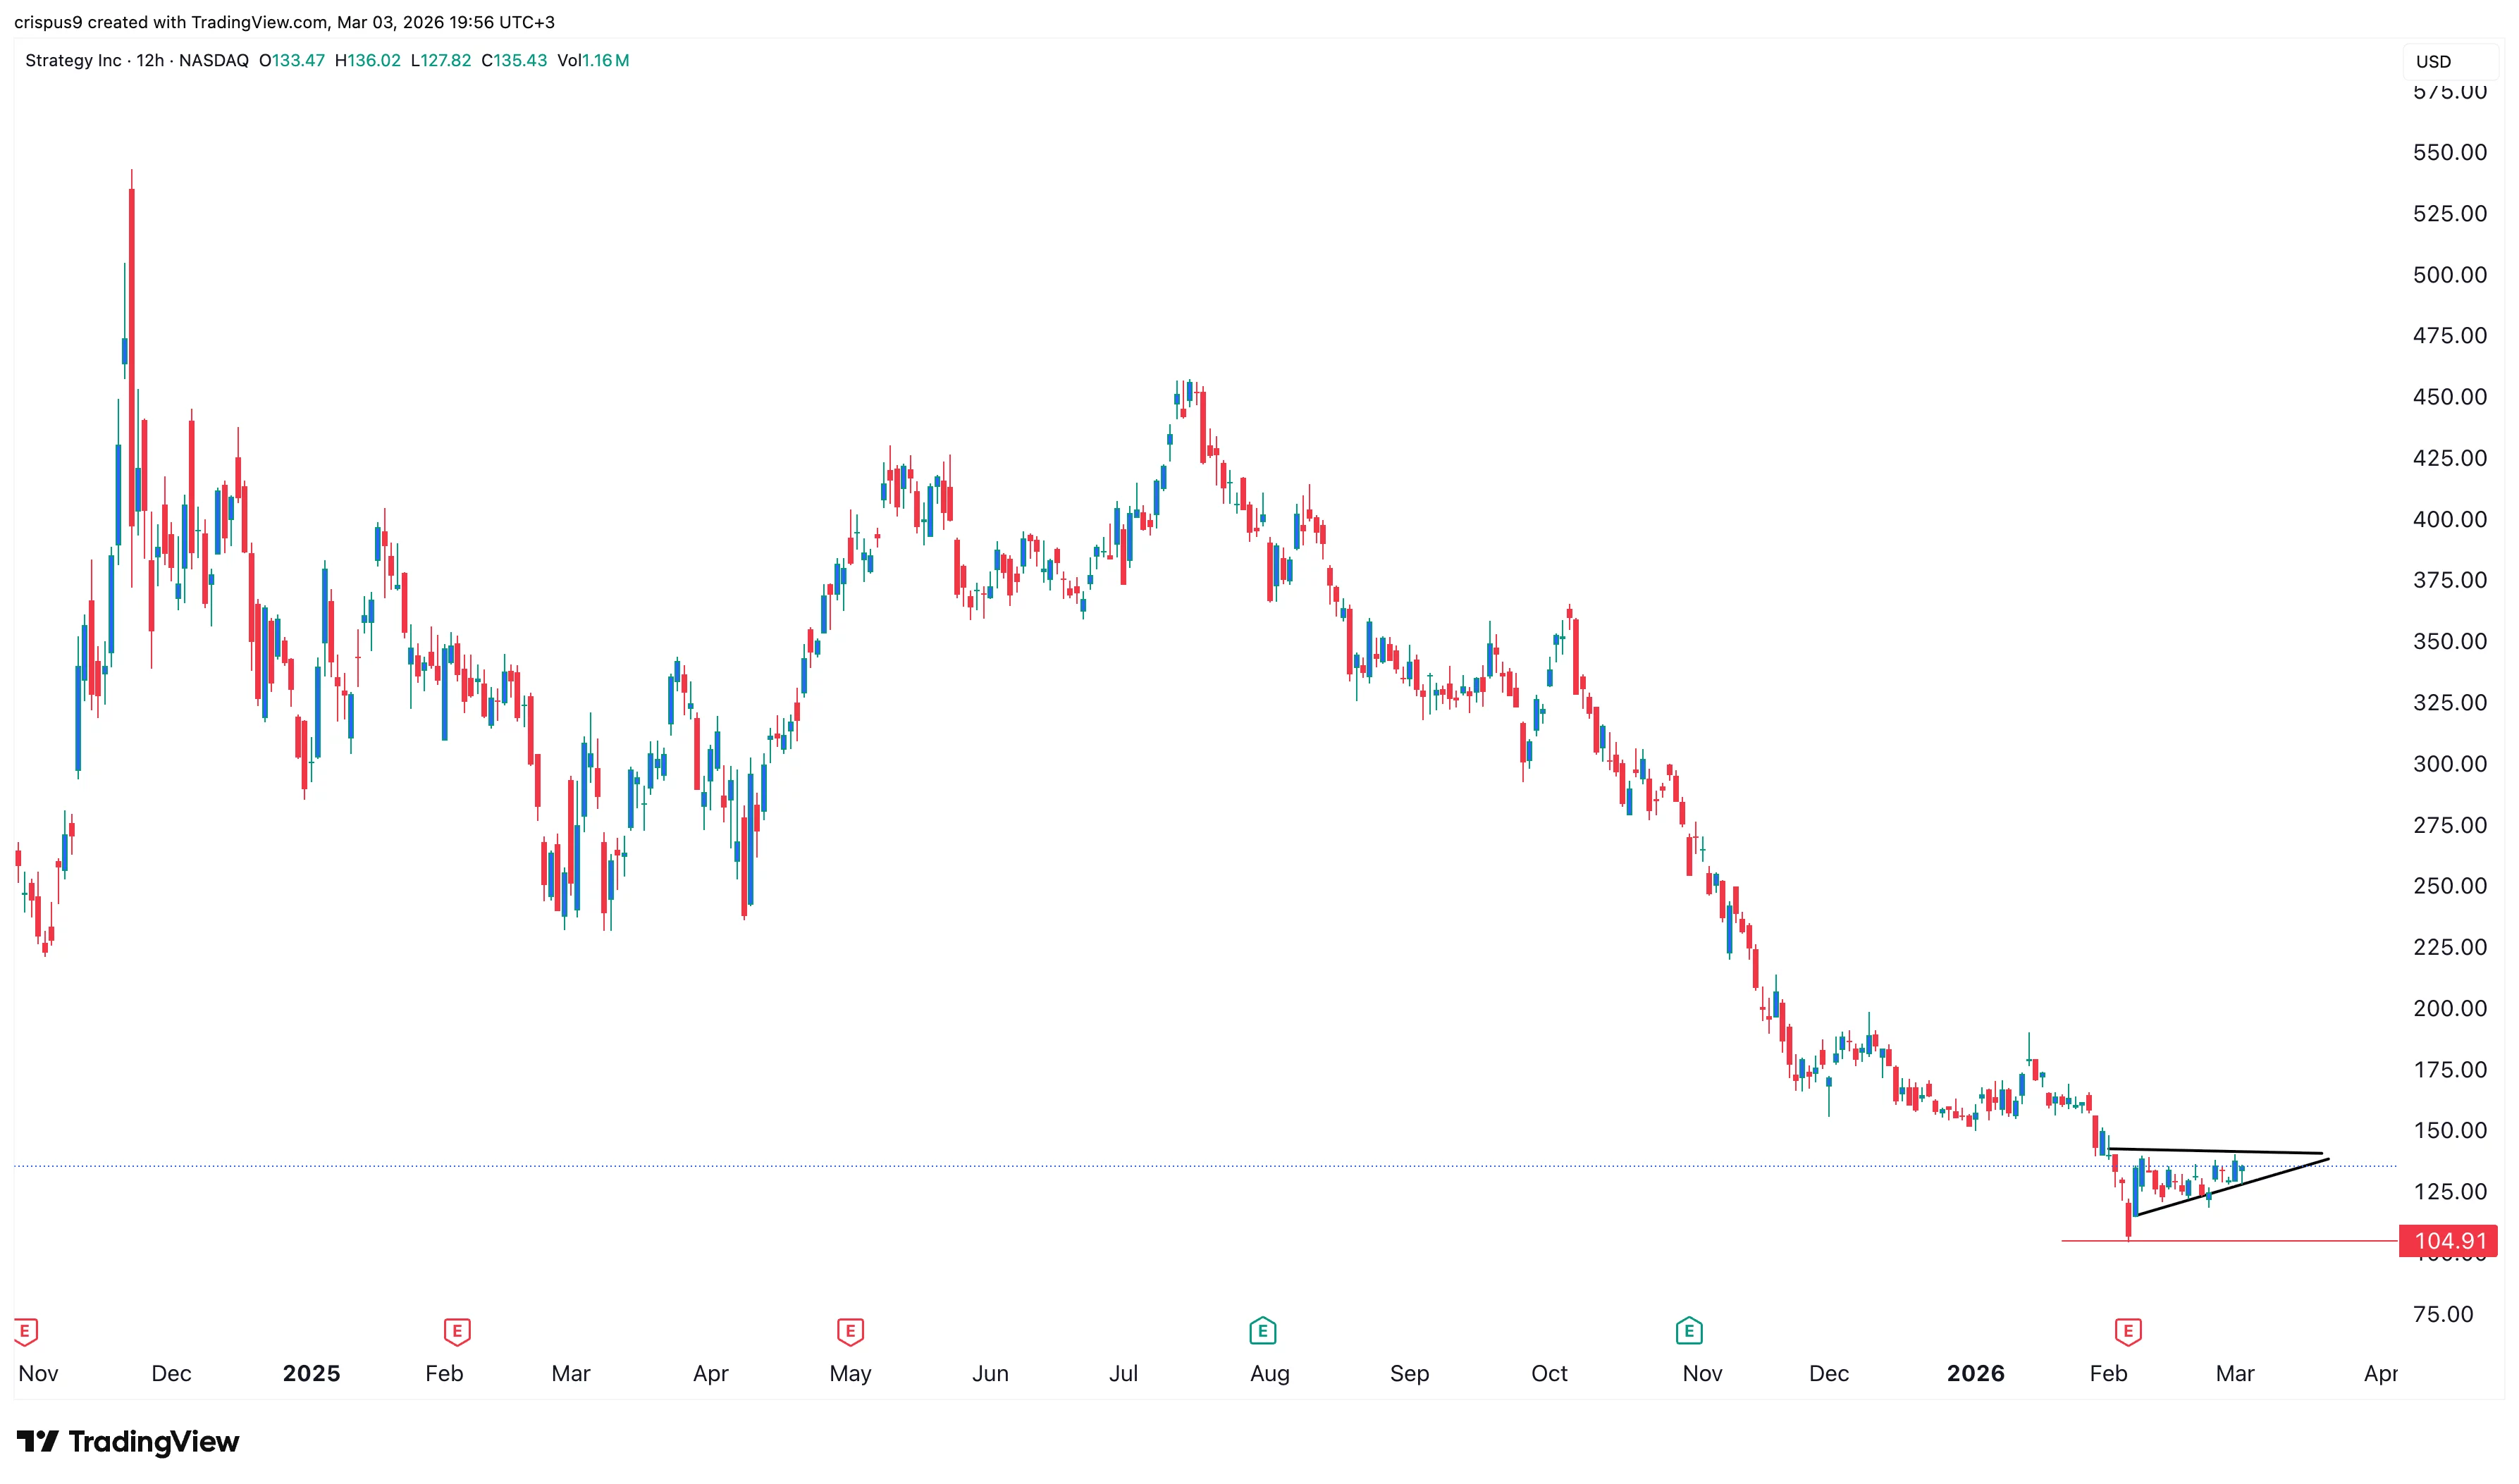
The 12-hour chart shows that the Strategy share price has wavered in the last month. By so-doing, the stock has formed a symmetrical triangle pattern, while the volatility has dropped. The Average True Range, which measures volatility, has continued falling.
A keener look shows that the two lines of the triangle pattern are nearing their confluence. Therefore, this triangle pattern mean that the stock is about to have a big move in either direction in the near term.
In case of a bearish breakout, the stock will likely retest the year-to-date low at $104, followed by $100. On the other hand, a strong bullish breakout may see it jump to the psychological point at $150 and above.