MSTR stock plot thickens as Strategy’s mNAV and Bitcoin price crash


Strategy stock price crashed below an important support level as Bitcoin fell below $110,000 and as its mNAV multiple reached its year-to-date low.
- MSTR stock price has crashed below an important support level.
- There is a risk that it will form a death cross pattern soon.
- Bitcoin price has formed a head-and-shoulders on the daily chart and a rising wedge on the weekly.
Strategy stock price traded $297 on Thursday, its lowest level since April, and 35% below its all time high. This crash has brought its market capitalization from the year-to-date high of $129 billion to now $84 billion.
MSTR stock plunged amid the ongoing crypto market crash. Bitcoin (BTC) fell below $110,000 for the first time since Sep. 1. Worse, as the chart below shows, it has formed a head-and-shoulders pattern, pointing to more downside in the near term.
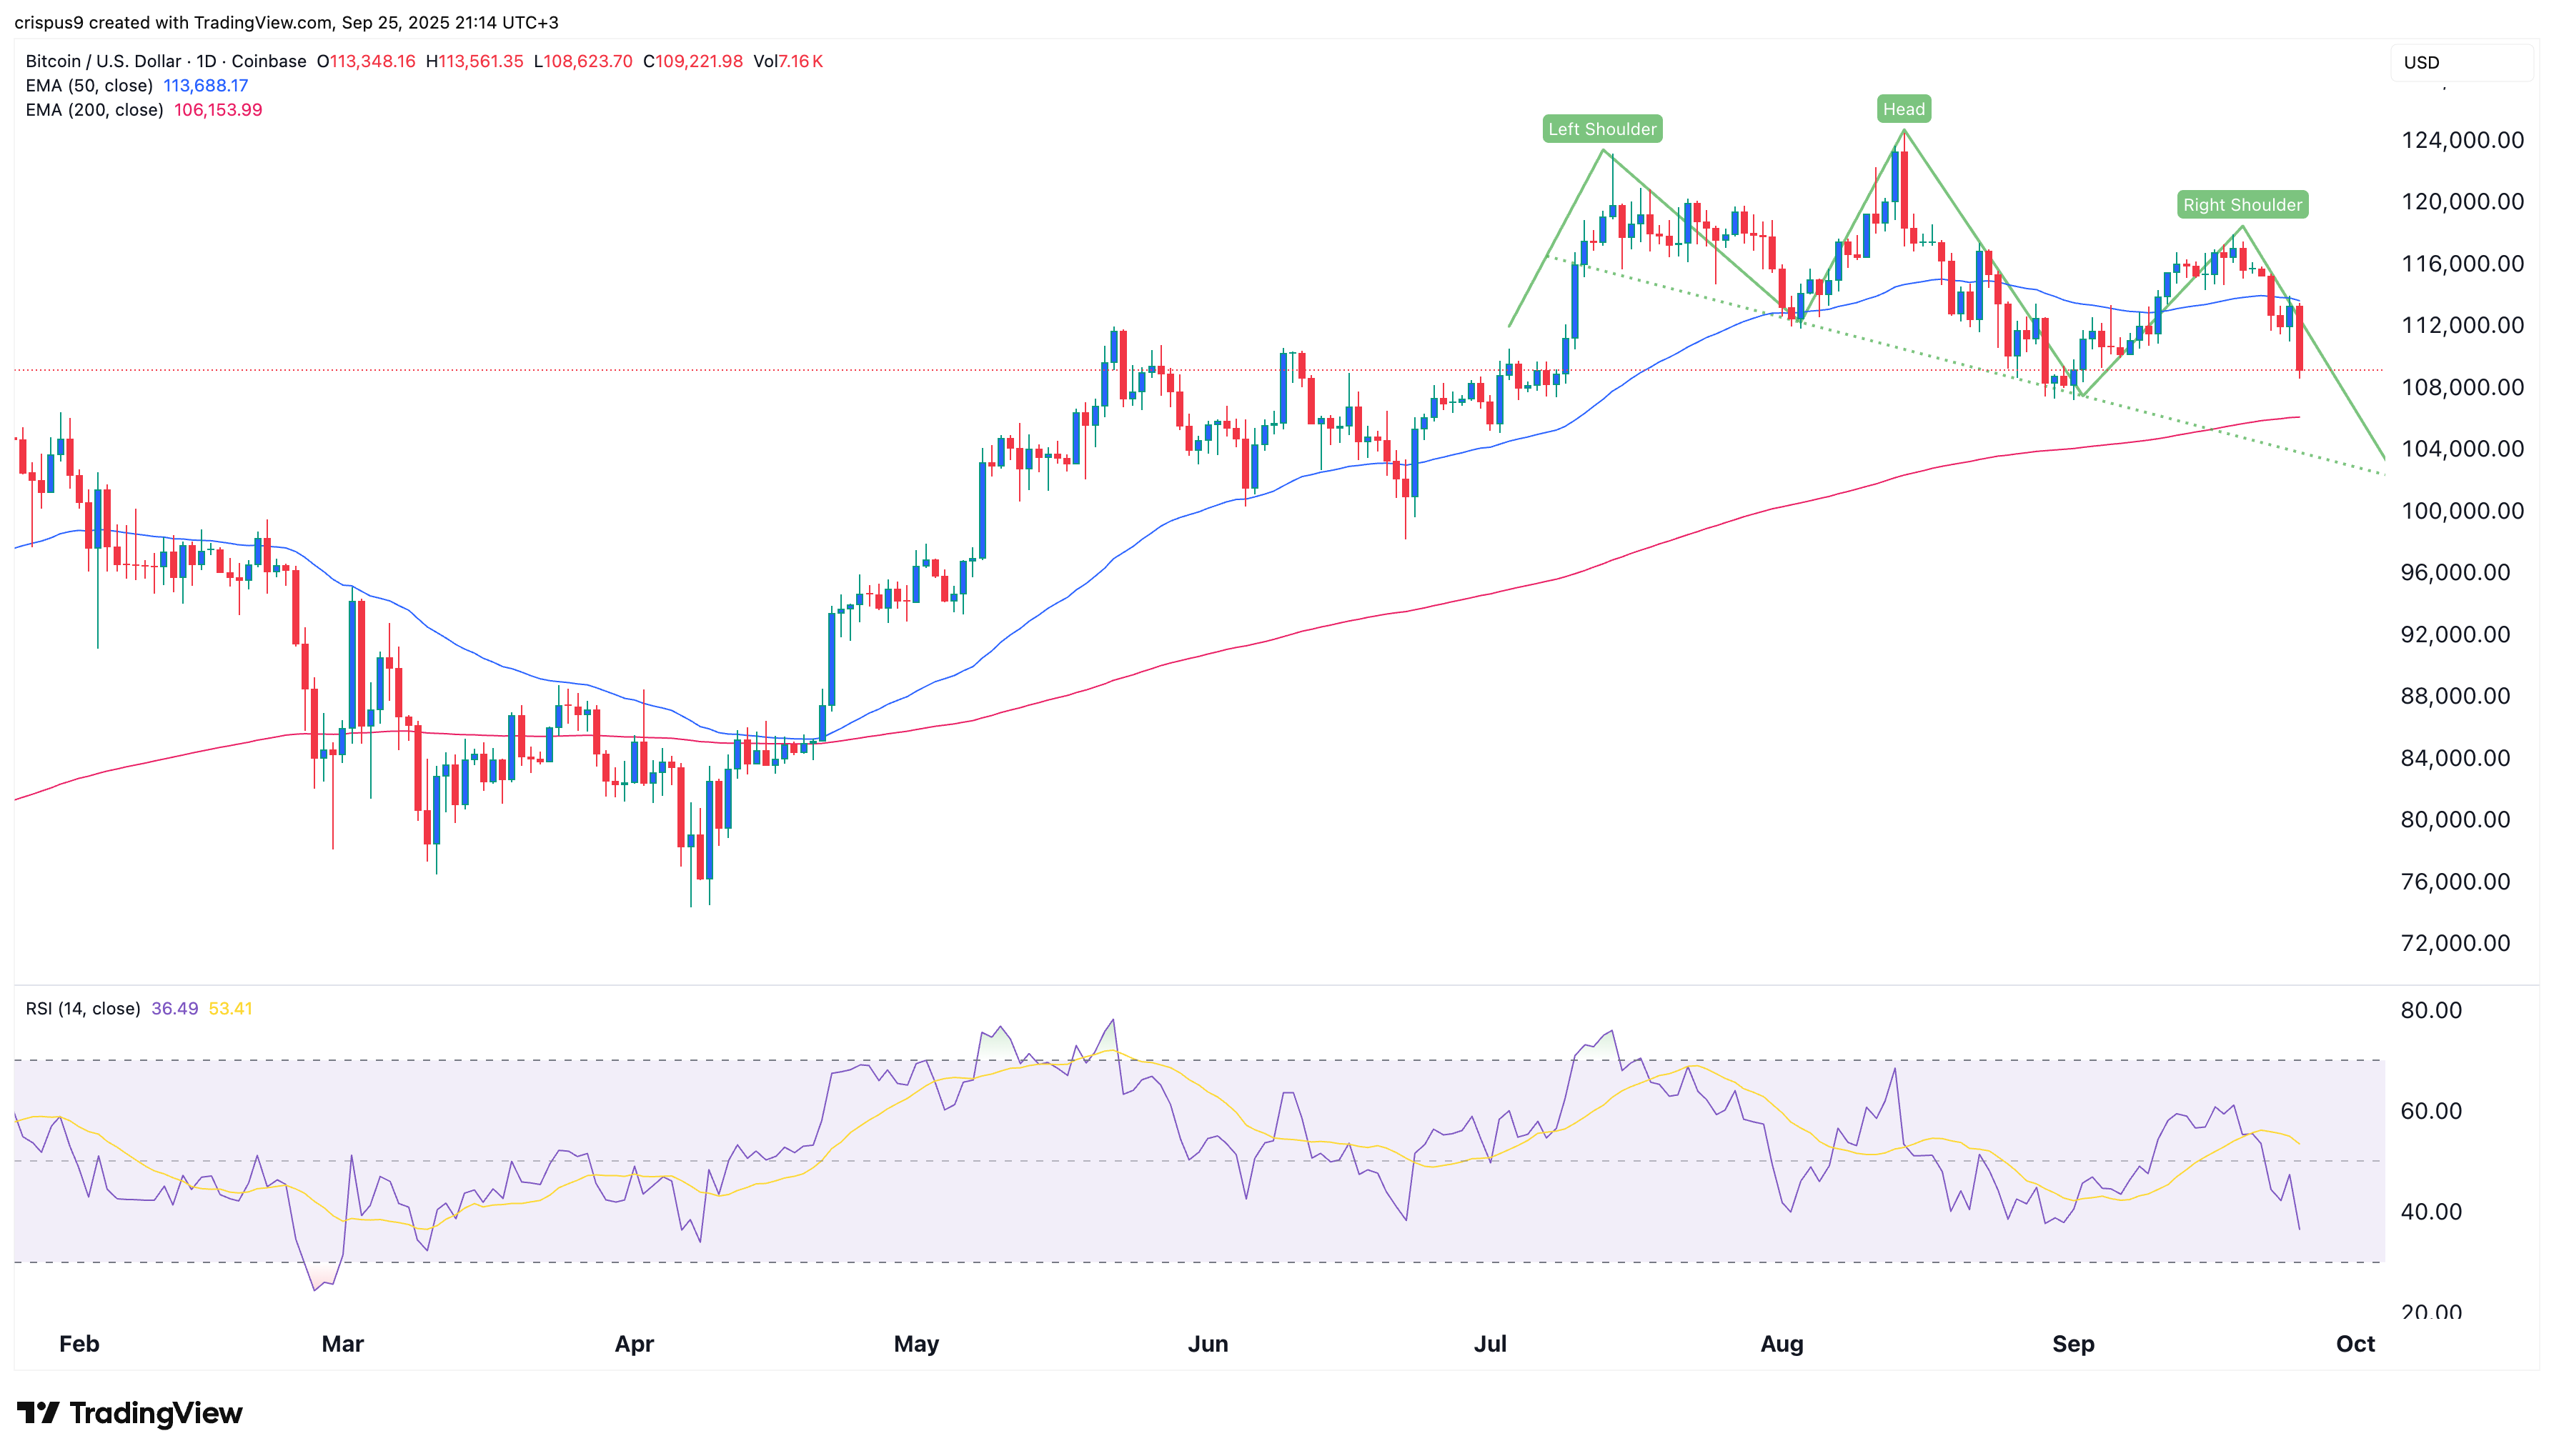
Bitcoin has also formed a giant rising wedge on the weekly chart, meaning that this could be the start of a prolonged bear market.
A prolonged Bitcoin price crash would be negative for Strategy, a company that has become the biggest holder globally. It holds 639,835 coins, currently worth $69 billion. The same coins would be worth $80 billion if it was at its all-time high of $124,200.
Most importantly, the falling BTC price means that the company’s premium has plunged. The closely-watched mNAV multiple has dropped to the year-to-date low of 1.195, down from the November high of 3.4.
The falling mNAV multiple is risky for the company because it uses its premium to raise capital, which it uses to buy Bitcoin. For a long time, Saylor’s rule was that he would not issue shares if the mNAV moved below 2.5. He changed it in August, opening the door for more dilution.
MSTR stock price technical analysis
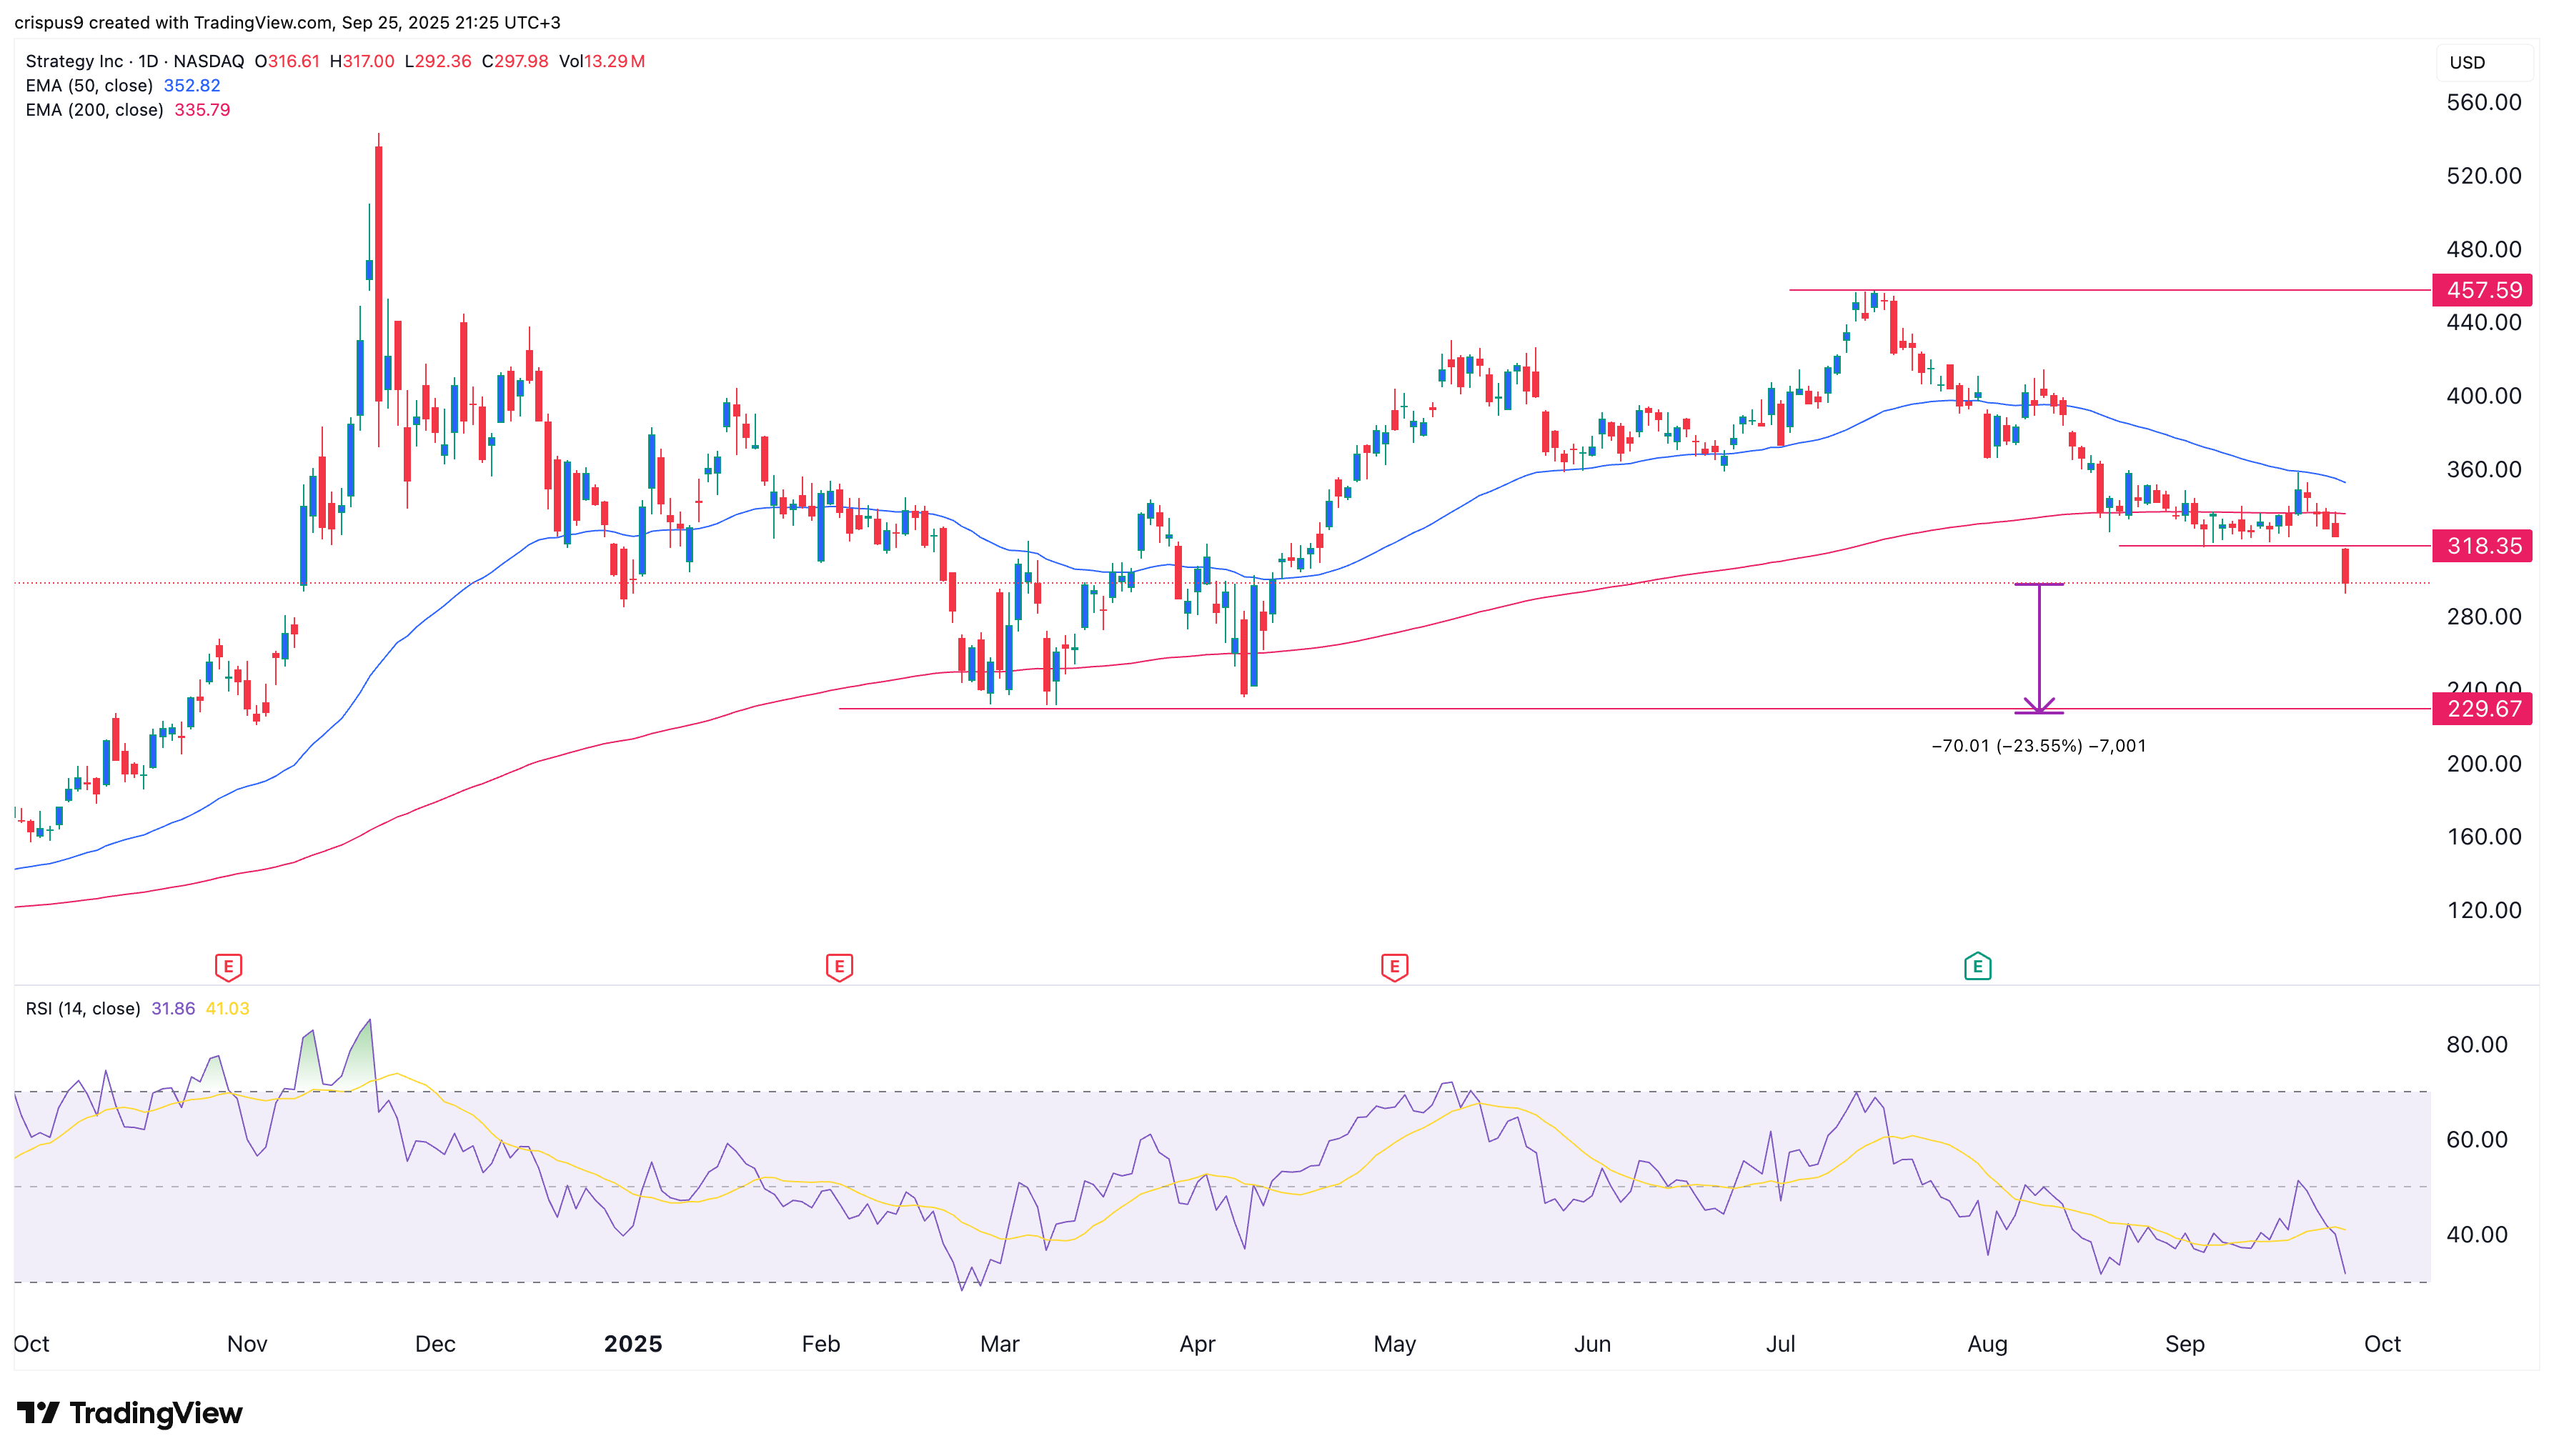
The daily timeframe chart shows that the MSTR stock price has crashed from a high of $457 in July to $295 today.
It dropped below the important support level at $318, where it failed to move below several times this month.
Worse, the stock is about to form the risky death cross pattern as the spread between the 50-day and 200-day Exponential Moving Averages has narrowed.
A death cross would lead to more downside, potentially to the important support level at $230, its lowest level in April this year. This target is about 25% below the current level.