MSTU and MSTX: these MicroStrategy ETFs are booming


Leveraged MicroStrategy exchange-traded funds are firing on all cylinders as inflows and their stocks surge.
MicroStrategy ETFs surge
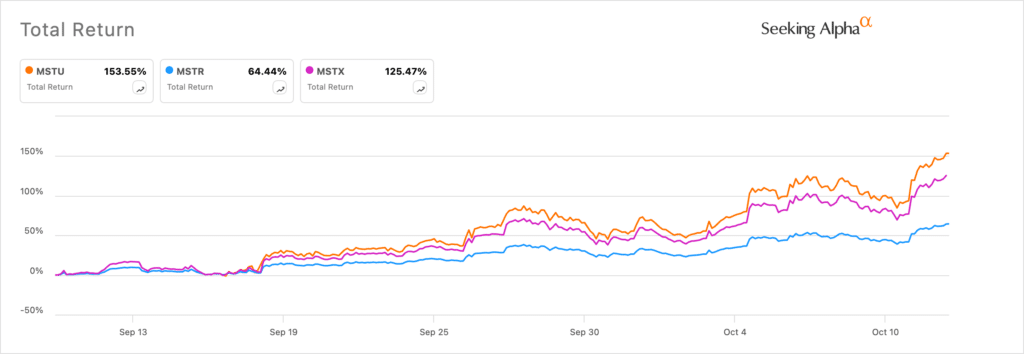
The Defiance Daily Target 1.75x Long MSTR ETF and the T-Rex 2x Long MSTR Daily Target funds have soared by 28% and 31%, respectively, in the last five days. MSTX and MSTU have also added over $207 million and $300 million in assets this year.
These ETFs have outperformed MicroStrategy stock, which has risen by 16.1% in the last five days.
The three assets continued their strong performance on Monday, Oct. 14, as Bitcoin (BTC) and other cryptocurrencies rebounded. MicroStrategy shares jumped by over 5.3% in pre-market trading, while MSTX and MSTU ETFs rose by 9.50% and 10.6%, respectively.
Bitcoin, the largest cryptocurrency by market capitalization, rose to $65,000 for the first time since Sep. 30, as the crypto fear and greed index exited the fear zone.
The potential catalyst for the rally was the decision by Chinese officials to offer more stimulus. In a statement, Finance Minister Lan Fo’an pledged to continue supporting the ailing property sector and hinted that the government would boost spending.
As a result, analysts at Goldman Sachs boosted their outlook for the economy. They now expect the economy to grow by 4.9%, higher than their previous estimate of 4.7%.
This statement led to a more upbeat tone in the financial markets, with stock indices in the US, Asia, and Europe continuing their uptrend.
MicroStrategy’s shares often react to Bitcoin’s price action due to the company’s substantial holdings. According to BitcoinTreasuries, it holds 252,220 coins in its balance sheet worth $16.3 billion.
MSTU and MSTX offer a high-risk, high-reward opportunity
Leveraged ETFs like MSTU and MSTX offer MicroStrategy investors a high-risk, high-reward opportunity by using leverage.
MSTU’s stock rises by 2x when MicroStrategy rises by 1% in a day, while MSTX rises by 1.75%. As such, their total returns over time are usually strong when MicroStrategy shares are soaring.
MSTU and MSTX aim to replicate the success of other leveraged ETFs, such as the ProShares UltraPro QQQ, which tracks the Nasdaq 100 index. The index has risen by 430% in the last ten years, while the TQQQ fund has jumped by over 2,360% in the same period.
However, the risk comes when the underlying asset underperforms. For example, the TQQQ ETF dropped by 79% in 2022 when the Nasdaq 100 index fell by 32%.