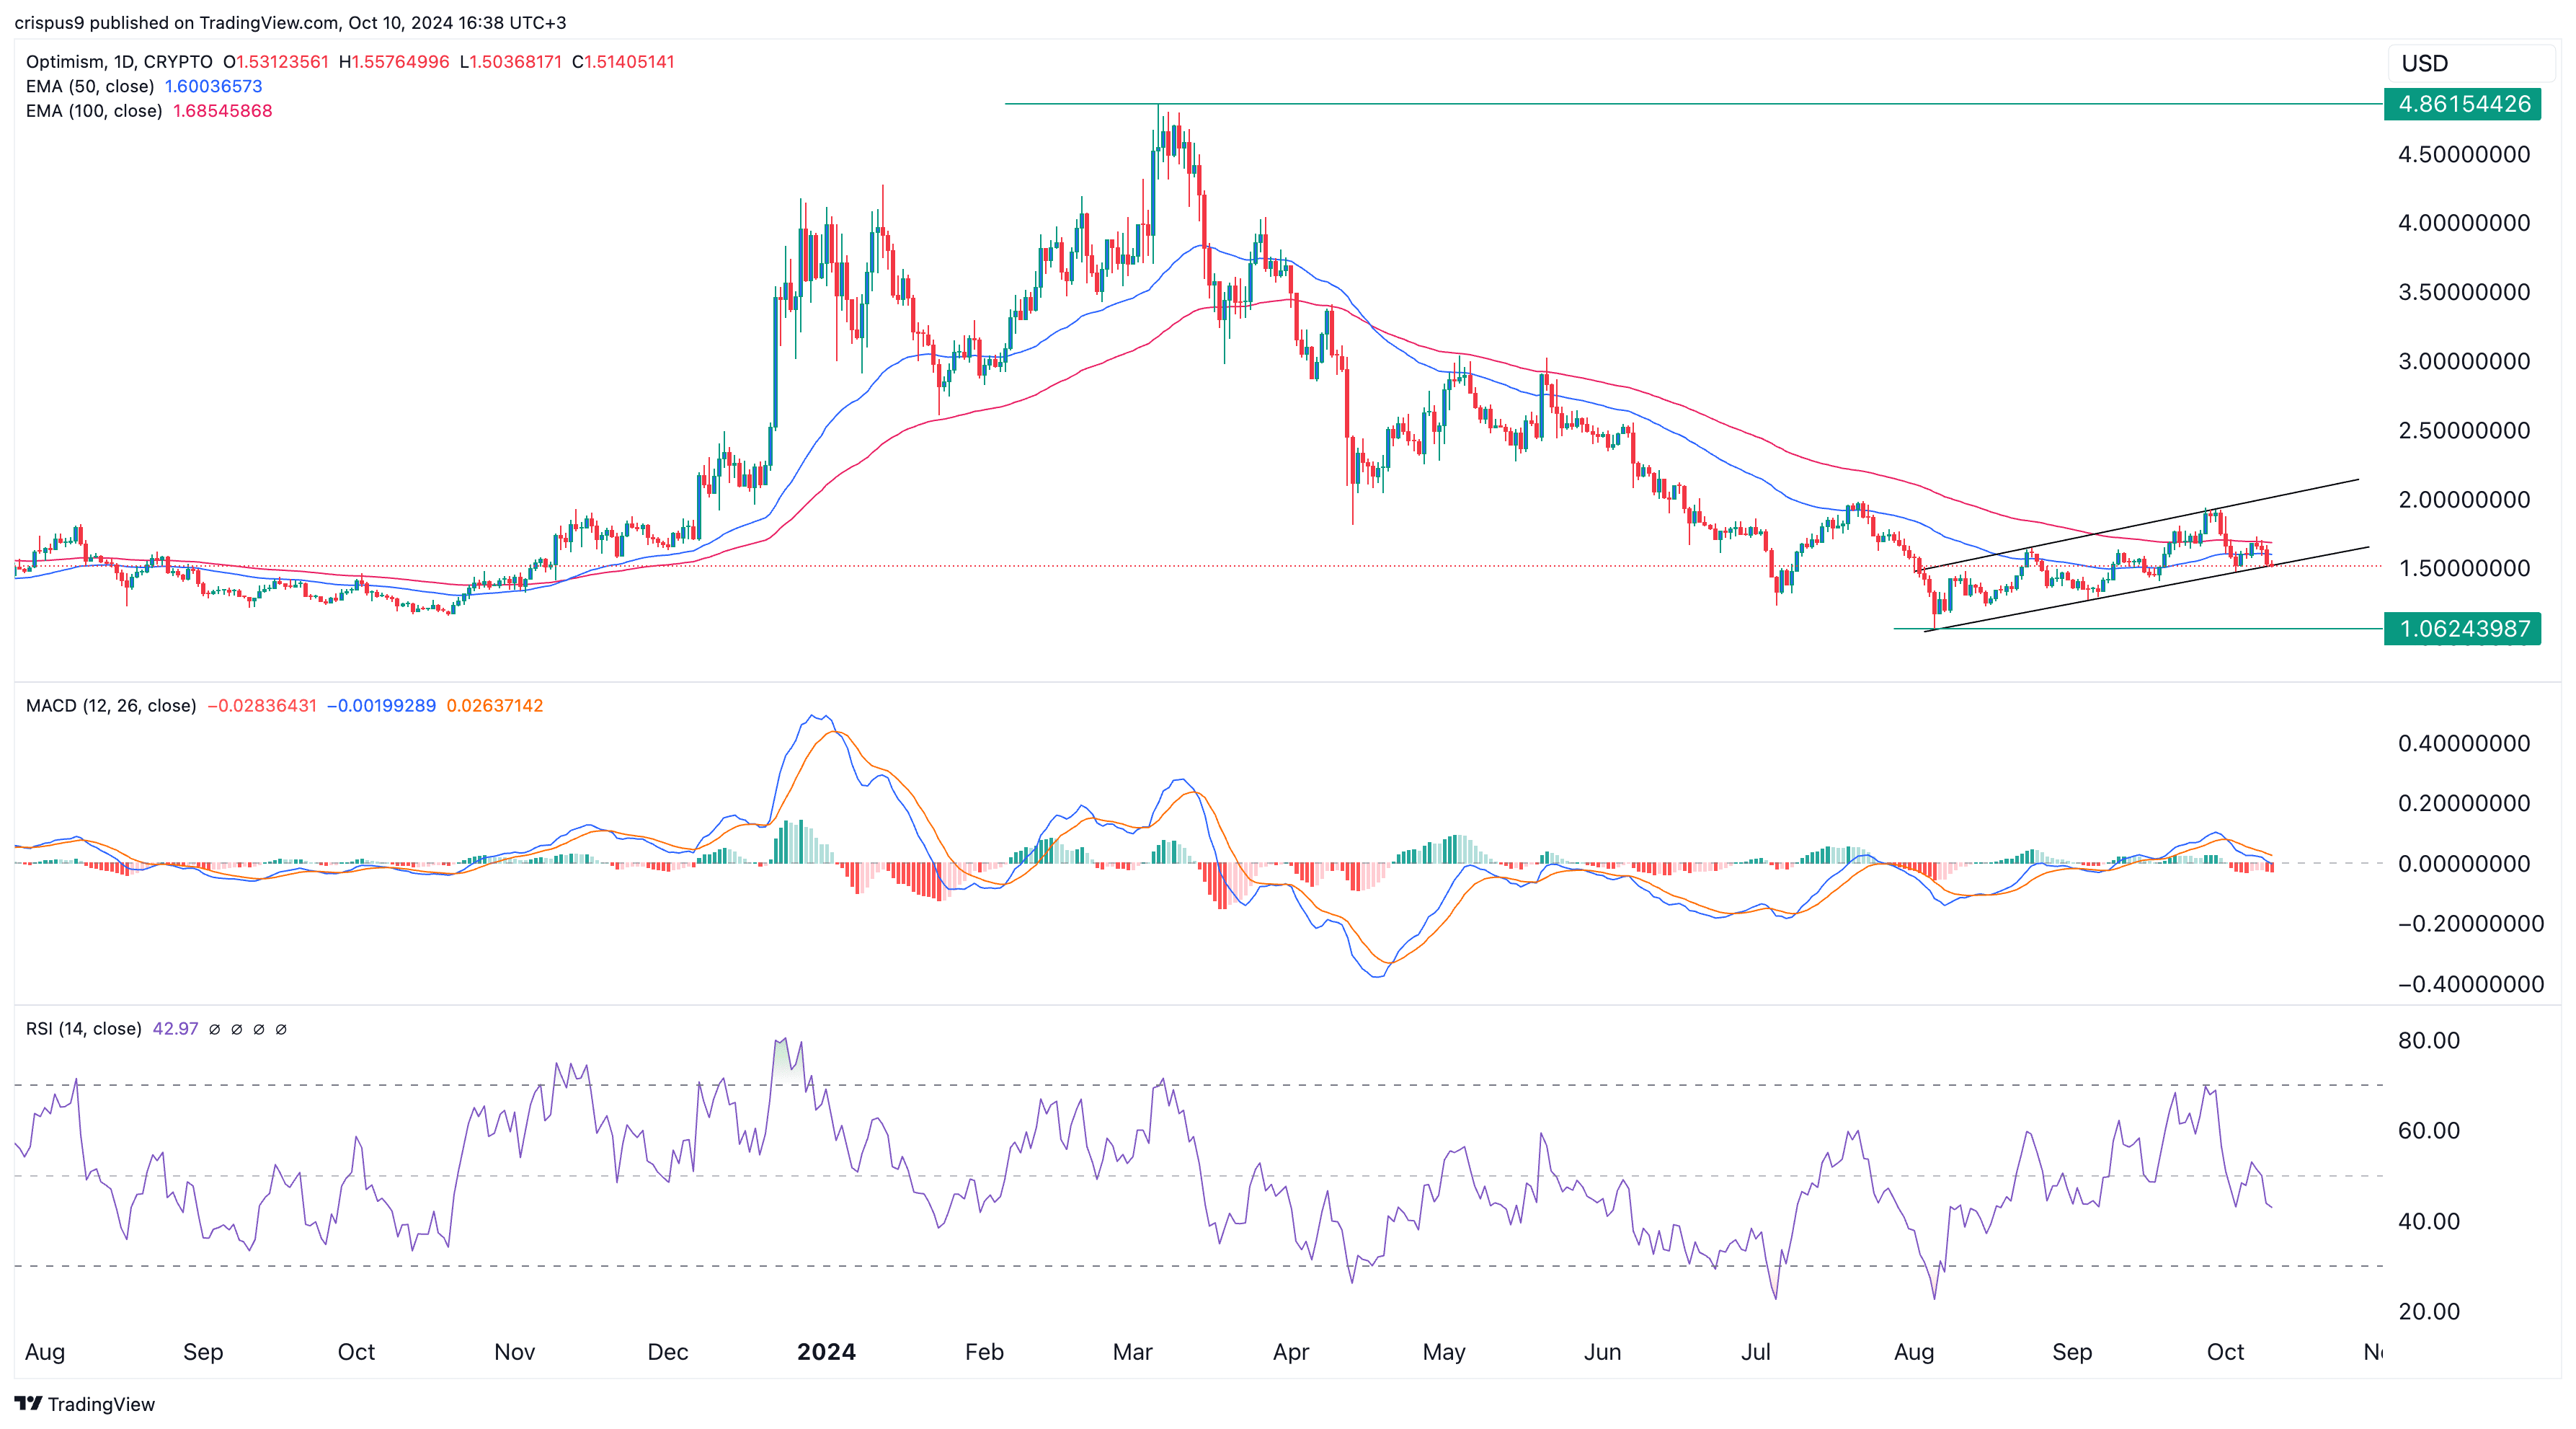
Optimism token price is at risk of a bearish breakdown

Optimism token remained in a deep bear market as the recent rally of most cryptocurrencies stalled.
Optimism (OP), a leading layer-2 token, was trading at $1.5140 on Oct. 10, down 70% from its highest point this year.
One reason Optimism has retreated this year is that the network has continued to lose market share in the industry.
It has been overtaken in key areas like decentralized finance by layer-1 networks like Avalanche (AVAX) and Sui (SUI). It has also been passed by popular layer-2 networks like Base and Arbitrum.
Optimism’s total value locked in the DeFi industry has dropped to $627 million, down from its year-to-date high of $1.04 billion. Additionally, the volume of stablecoins in its ecosystem has fallen from the year-to-date high of $1.35 billion to $1.17 billion.
Furthermore, its role in the DEX index industry has diminished, with weekly volume declining by 24% to $503 million, while Sui’s and Base’s volume has jumped by 51% and 5%, respectively, during the same period.
OP’s price retreated after developers unveiled its fifth airdrop, unlocking 10 million OP tokens to 54 million.
It now has 500 million OP tokens remaining for future airdrops, meaning existing holders can expect further dilution.
Most of this dilution will occur because Optimism has a circulating supply of 1.25 billion tokens against a maximum supply of 4.29 billion. According to Defi Llama, the network unlocked 49.19 million tokens in September, with the final unlock scheduled for 2026.
Meanwhile, Optimism’s volume in the futures market has also declined. Data shows that futures open interest dropped to $104 million on Oct. 10, down from the year-to-date high of $327 million.
Optimism token is at risk of more downside

On the daily chart, the OP token has been in a strong downtrend since peaking at $4.86 in March.
It has remained below the 50-day and 100-day Exponential Moving Averages. Additionally, the Relative Strength Index, which measures the rate of change, has pointed downwards.
Optimism has also formed a bearish flag pattern, suggesting the potential for a bearish breakout. If this occurs, it could drop and retest the support at $1.06, its lowest point in August.


