Palantir stock forms an alarming pattern, despite strong Q4 forecast


Palantir stock price remains under pressure, mirroring the performance of other software companies like Microsoft, Adobe, ServiceNow, and Intuit.
- Palantir stock price has crashed in the past few weeks.
- The stock has formed a head-and-shoulders pattern on the daily chart.
- Technical indicators like moving averages and the Supertrend indicator points to more downside.
The Peter Thiel-backed technology company’s stock price is currently down 10% year-to-date. Economists expect the company’s next financial report, scheduled for publication after the market closes on Monday, to be stellar.
After all, analysts estimate a 62% revenue jump in the fourth quarter to $1.34 billion, thanks to its U.S. corporate segment attracting more customers. Its earnings per share are expected to grow by 64% to 23 cents.
If these estimates are correct, Palantir’s annual revenue will be $4.4 billion, up by 53% from what it made in 2024, making it one of the fastest-growing companies in the U.S.
On the positive side, the company has a long track record of beating estimates, so its figures are likely to be better than most analysts expect.
This growth is being driven by its Artificial Intelligence Platform, commonly known as AIP, which helps companies to integrate generative AI into their operations. It builds on Palantir’s Gotham and Foundry suite of products to create an AI operating system.
3 main risks
First, the results come at a time when demand for AI companies is waning, as evidenced by the recent plunge of companies like Microsoft, Adobe, and ServiceNow.
Second, and most importantly, the company is among the most overvalued in the U.S., with a forward price-to-earnings ratio over 200, much higher than those of companies like Nvidia, Microsoft, and Amazon.
Consider the technical analysis below.
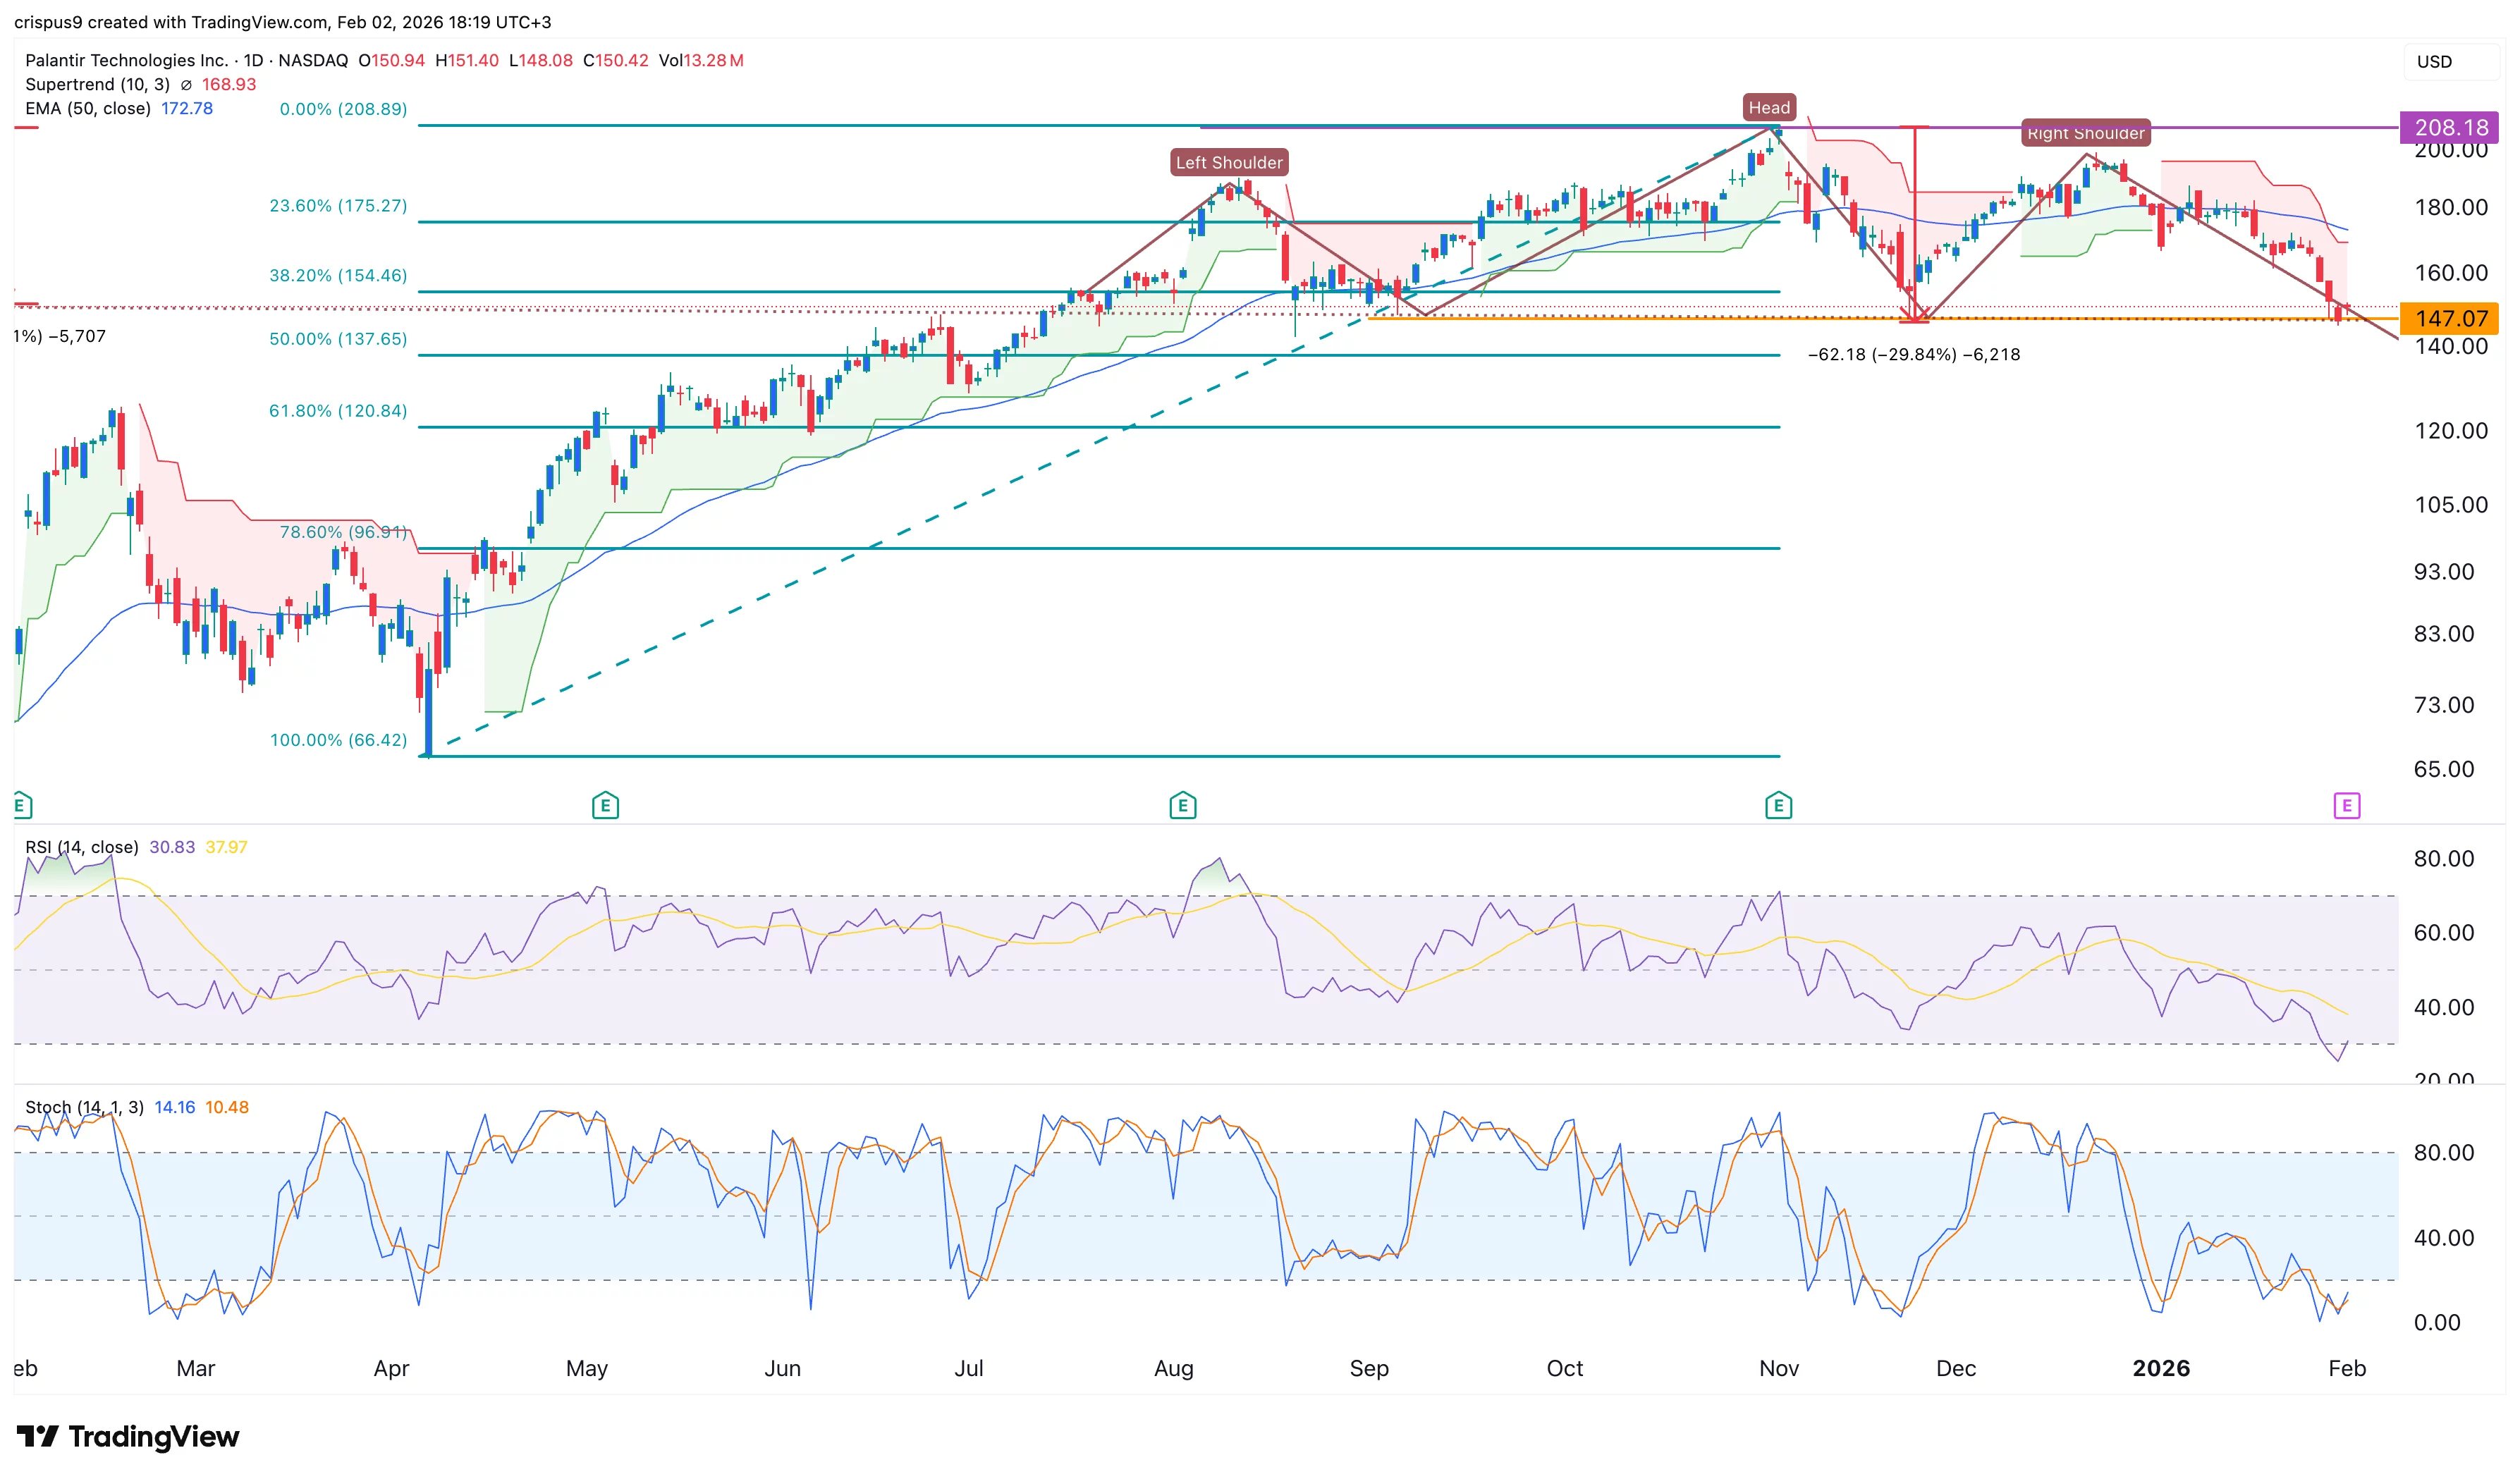
The daily timeframe chart shows that the PLTR stock price has formed a nearly perfect head-and-shoulders pattern, which often leads to further downside.
Its head is at the all-time high of $208, while the neckline is at $147, where it was trading before the earnings. The distance between the head and the neckline is about 30%.
Measuring the same distance from the neckline points to the eventual drop to $102. Before this happens, the stock will likely drop by 20% to the 61.8% Fibonacci Retracement level.
Another bearish catalyst for Palantir stock is that it has moved below the 50-day and 100-day Exponential Moving Averages and the Supertrend indicator. Also, the Relative Strength Index and the MACD indicators have continued falling.