Panic Sends BTC-USD Below $600; Strong Support Seen at $540

Following the high-profile DAO attack, markets have moved into panic mode with BTC-USD breaking below $725, the critical support level highlighted in our price analyses last week. Buyers were only able to extend to highs around $778 before momentum switched as investors began to question the extent of the influence of the attack on Bitcoin’s credibility. Since then, sellers have dominated. The price action has broken below both the $700 and $600 psychological support levels, with the current price at $582.54 on the BitStamp exchange, down 3.12 percent on today’s open.
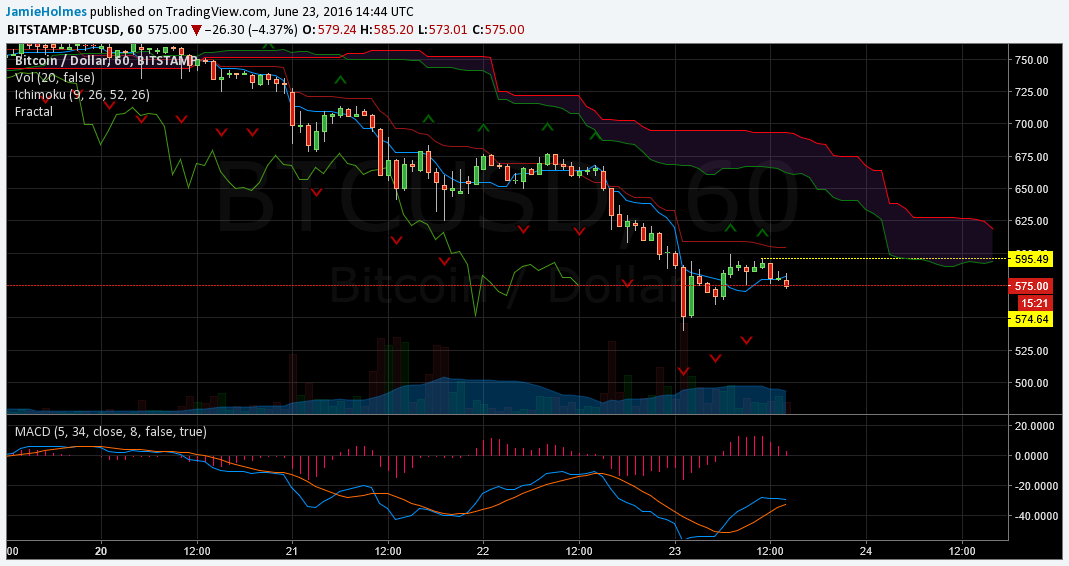
The chart below illustrates the short-term outlook with the hourly price action for BTC-USD. The market is consolidating after posting a fresh low at $540.17, which is now an important fractal support level. The chart illustrates that sellers are in control as the price is below the Ichimoku cloud (red), and the base (dark-red) line is trending above the conversion (blue) line. Therefore, in the short-term we should look for opportunities to sell.
The market is currently looking to break the most recent fractal buy level at $574.64, shown on the chart below with the yellow ray. A break below this levels should see the market start to gain traction and begin trending downwards again, with sellers eyeing $530 and $500. Also, momentum is starting to turn bearish as indicated by the MACD indicator at the bottom of the chart; a downward crossover looks imminent, suggesting the start of another downward trend. On the other hand, a bullish outlook will only be validated if there is an hourly close above $595.49.
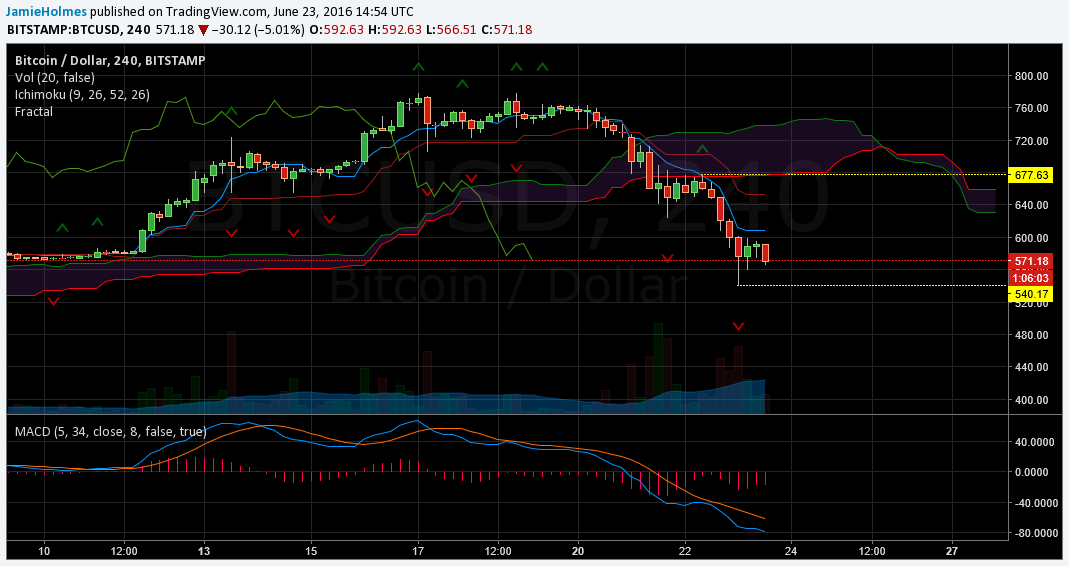
The longer-term outlook is shown by the 4-hour chart below. The market managed to post a low at $540.07, which is the most recent fractal buy level, providing strong support going forward. Whether or not the market floats above this level is key to determining the future trend of BTC-USD. If we remain above this level, then we should see the price rise, whereas if there the market manages to sustain below this level then the price will most likely continue to fall. Two important support zones could be found at previous fractal resistances at $500 and $480.
Also, notice the candlestick formed at this fractal level, known as a ‘hammer’; it shows that sellers tried to push lower in that 4-hour session, but buyers managed to regain control and closed the price at $577.03. This candlestick is generally found at the end of downward trends.
The conversion line is currently offering minor resistance at $608.90. A 4-hour session close above this level will see a switch to bullish momentum; the market should then look to attempt to test the resistance provided by the base line at $652.55. Also, notice that the most recent fractal resistance is quite high relative to the market price at $677.63, suggesting a lot of room to the upside if bulls manage to shift momentum in their favor. However, the MACD is indicating bearish momentum is in play as the histogram is negative. An upward cross-over of the MACD indicator will provide an opportunity to get into an uptrend. Otherwise, short positions should be favored as we notice the price action is below the Ichimoku cloud.