Price Analysis: Will Selling Pressure Intensify for BTC-USD?

Increasing trading volumes over the past three days has helped to propel BTC-USD to a recent high of $678.00 on the BitStamp exchange. However, today buying interest has dampened with the price retreating to $661.18 at the time of writing. Yesterday, the market managed to close above the base line on the daily timeframe, indicating a switch to upward momentum over the long-term. Sellers should look for a daily close back below the base line which is currently at $659.51; a close above this level today should see further gains in the days ahead.
The chart below illustrates the medium-term outlook with the 4-hour price action on the BitStamp exchange. It shows that the market is currently just above the support zone provided by the Ichimoku cloud from around $645 to $655 for the next 48 hours. The market has recently closed below the conversion (blue) line suggesting a higher probability of further downward moves. If we see a break below the cloud then this will signal that bearish momentum may start to dominate. Therefore, sell positions are favoured if BTC-USD breaks below the cloud, that is below $646.37.
On the other hand, a good entry into long positions can be found inside the cloud as it is relatively thick and should provide strong support, along with other features of the Ichimoku: the conversion line is trending above the base (red) line, suggesting bullish momentum is in play; the cloud projected forward is green; and the lagging (purple) line is above the previous price action. However, the market has moved below the conversion line, suggesting that the next target for the market is support found at the base line at $652.
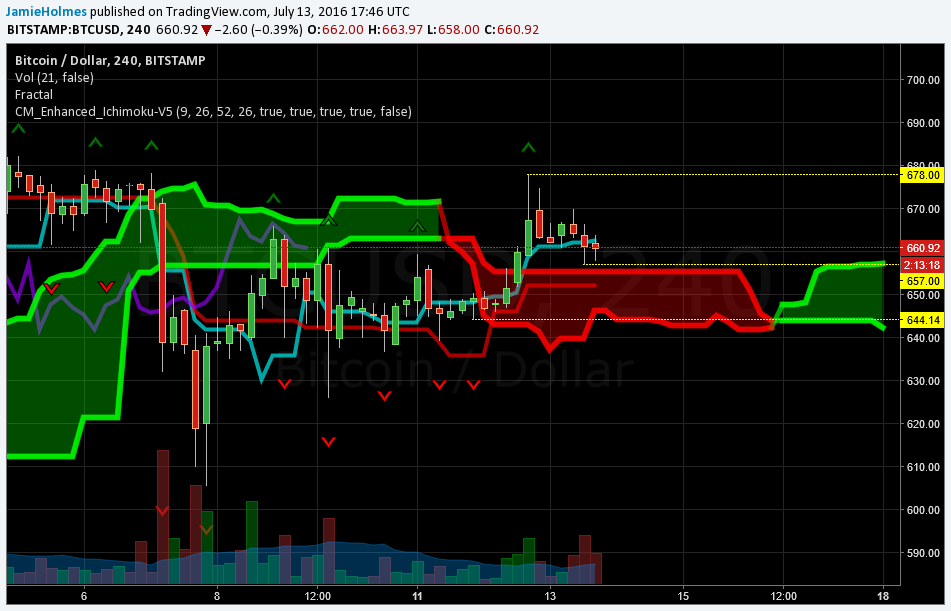
The chart also illustrates the two most recent fractal levels at $644.14 and $678.00, which are key support and resistance levels respectively. One could take advantage of a longer-term breakout by placing limit orders just above $678.00 to buy BTC-USD or just below $644.14 to sell BTC-USD. If either of these levels break we should see an intensification of the market’s momentum.
Also, notice that a new fractal buy level may form support at $657. A fractal at this price will be confirmed given that the lowest low is higher than $657 for the immediate and preceding 4-hour sessions. That is, if the lowest low over the next six hours is higher than $657 then a crucial support level will be formed. Should this scenario occur, a bullish outlook for BTC-USD will result, as this support is just above the Ichimoku cloud, confirming a strong support zone in this area.
The short-term outlook is illustrated below with the 1-hour price action. The outlook is pretty mixed; the base line is trending above the conversion line suggesting bearish momentum is in play over the short-term. The lagging line also looks to be crossing below the previous price action which will also provide a bearish signal. But the market is near to the support zone provided by the cloud and there is a divergence between price and volume. While volumes traded on the BitStamp exchange have increased over the course of today, the price has fallen which suggests the market should trend higher.
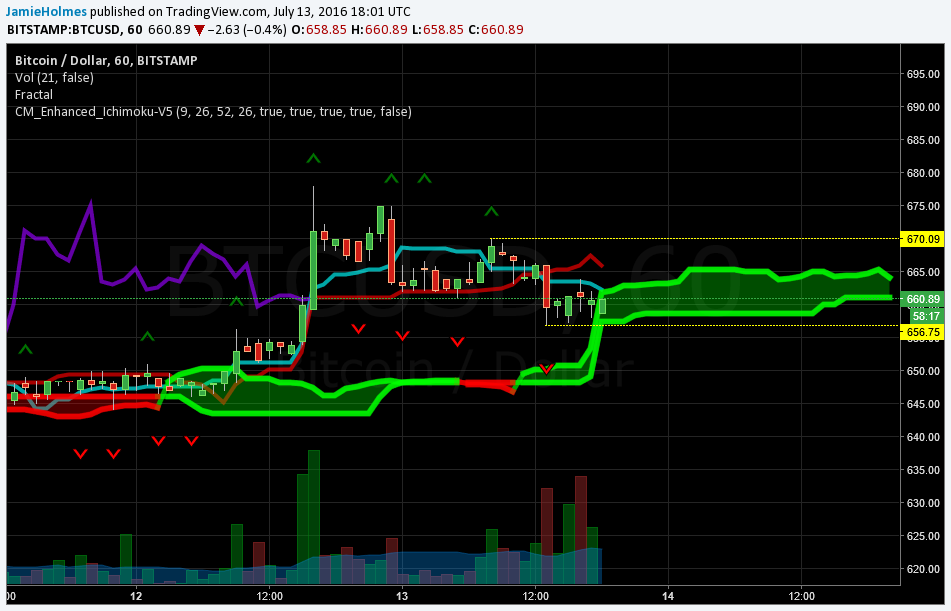
The most recent fractal levels at this timeframe are at $656.75 and $670.09. A break above $670.09 should see the psychological $700 tested, whereas a break below $656.75 will open up previous lows around $644. The market is currently inside the Ichimoku cloud, suggesting a breakout to either side could materialise. However, notice that the base line and conversion line have started to trend lower, so we are more likely to see a short-term dip towards $650-$645. Also, this is further supported by the fact that the cloud looks to be changing from green to red, shown in the chart above.
The change in the cloud color from green to red suggests that the short-term trend is changing from up to down. For example, the chart shows that the cloud was pretty much continuously green in color since July 12th. and this signal was given at $646.30 26, hours previously. Then the market entered an uptrend peaking at $678.00. Therefore, the change to a red cloud should see the market establish a fresh low.