Price Recovers to $420s After Fresh Low of $393 Over Christmas

As we head into the New Year, BTC-USD has experienced a sharp sell-off, losing almost 9% on Boxing Day after seeing muted price action, moving only slightly higher over the Christmas holiday. Boxing Day saw the largest price drop since January 15th 2015, when the commodity lost more than $50 in one day. A fresh low at $393.22 was posted on the OKCoin exchange; however, buyers have pushed the price back above the $400 psychological support to a recent high of $426.
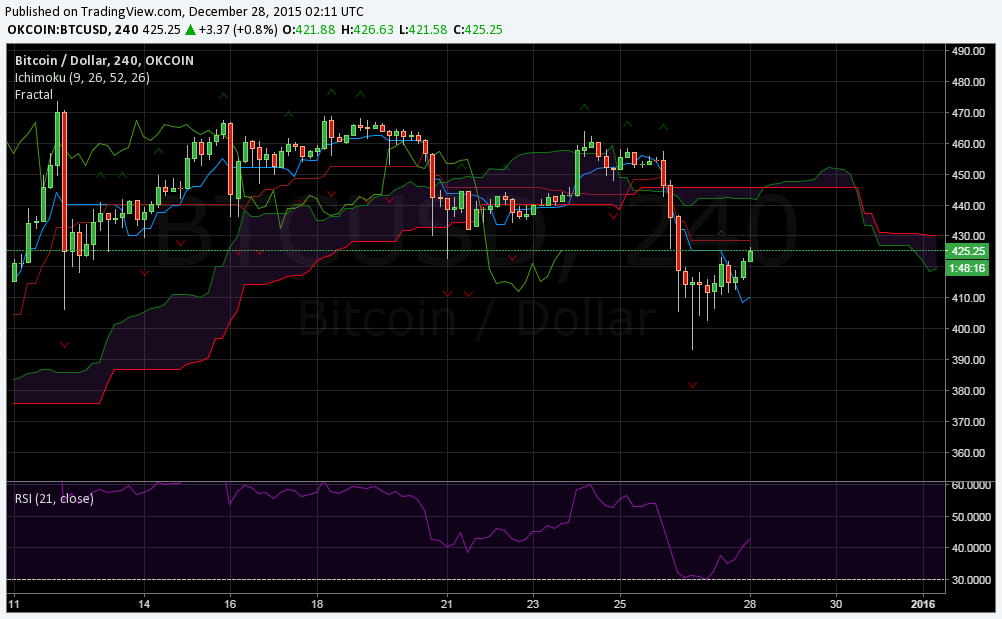
Medium-term outlook
The chart below shows the 4- hour price action on the OKCoin exchange, along with the Ichimoku indicator, fractal levels and the Relative Strength Index. The sell-off has seen the price move below the Ichimoku. This is also confirmed by the lagging line, which has also moved below the cloud. The Ichimoku cloud now acts as resistance around $445 going forward, then falling to around $430 for the last day of 2015.
Bearish scenario
The best opportunity for sellers lies at the base (red) line in the chart below and the Ichimoku cloud. The base line currently offers resistance at $428.65 and if this holds then downward momentum is anticipated. The next sell zone lies around the Ichimoku cloud. Also, if the relative strength index fails to break above 50, that signals buyers are weakening and presents a good opportunity to short BTC-USD. A daily close below $414.12 would give a strong bearish signal at the daily timeframe with targets of $400.00 ad $382.00 over the long term.
Bullish scenario
We’ve seen a weak bullish signal recently as the price has crossed above the conversion (blue) line. The chart below also shows that the conversion line has started trending upwards, further confirming a bullish outlook. The relative strength index is trending upwards and bulls will be further vindicated when the index crosses above 50. A daily close above $428.96 will validate a bullish outlook over the long-term, with a re-test of recent highs around $460 looking to be the next move.
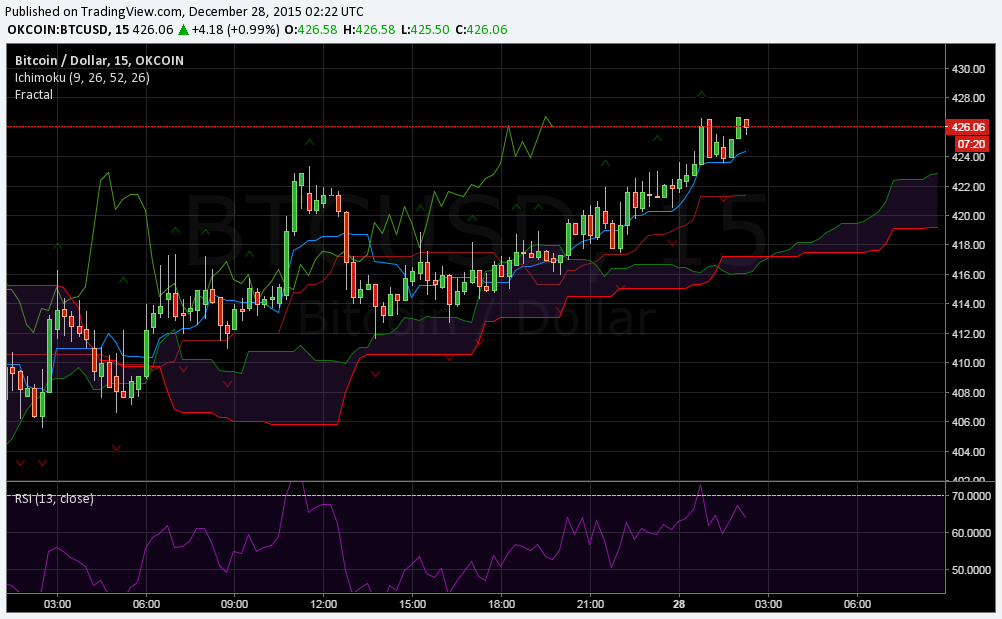
Short-term outlook
The shorter-term outlook is shown in the chart below, illustrating the 15-minute price action. The price action is currently above the Ichimoku cloud suggesting an upward trend is in place. However, at present, the Relative Strength Index is trending downwards, suggesting some bearish momentum is in play.
Bullish scenario
A break above the most recent sell fractal at $426.63 will validate a bullish outlook over the short-term with possible targets at $437 and $452. If further downward moves are made in the market, then bulls should look for support at the conversion and base lines, at $424.37 and $421.38 respectively. If these levels hold as support, then bullish momentum is expected to dominate. The Relative Strength Index is below 70, suggesting further upward moves are a strong possibility as the market is not yet overbought.
Bearish scenario
A break below the conversion line should precipitate a test of support provided by the Ichimoku cloud around $420; targets in this case for the bears will be $400 and $382. Also, the most recent buy fractal is at $423.60 and a close below this level at the 15 minute timeframe should see bearish momentum dominate. If the Relative Strength Index crosses below the 50 benchmark then we should see a test of $400.