Quant price forms a rare pattern: 70% surge is likely


Quant price has rebounded in the past few months following its expanded partnerships with the European Central Bank and Oracle, and has formed a rare chart pattern that points to further gains in the coming weeks.
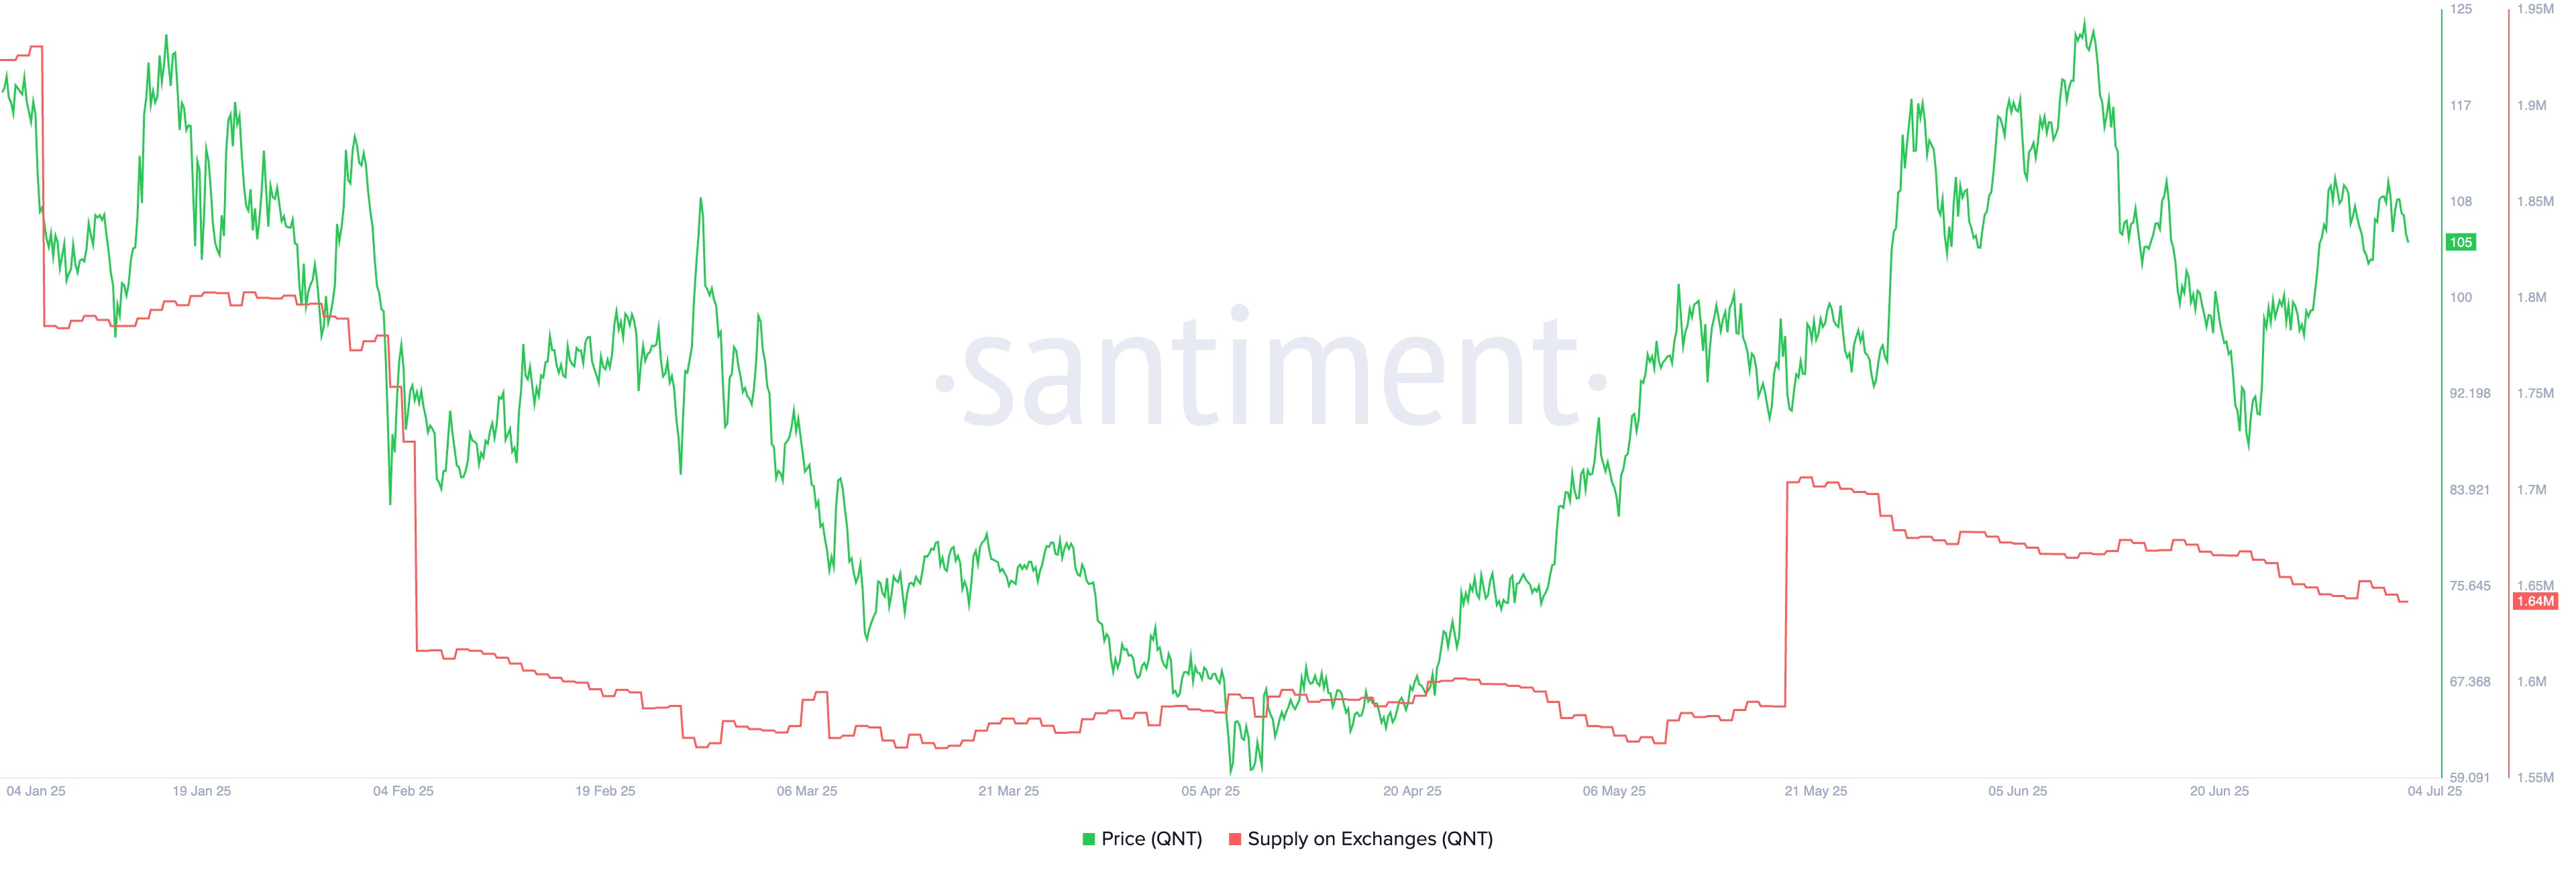
Quant (QNT) was trading at $105 on July 4, up over 75% from its lowest level this year. This rally has brought its market capitalization to over $1.2 billion, ranking it as the 60th largest coin in the industry.
Quant Network gained traction earlier this year when Oracle launched the Oracle Blockchain Platform Digital Assets Edition using its technology. OBP DA is an enterprise-grade solution designed to streamline the development and deployment of digital asset applications.
It simplifies and accelerates tokenization efforts by integrating a robust distributed ledger infrastructure with pre-packaged smart contracts. Oracle utilizes Quant’s Overledger solution in this product.
Quant Network further rallied after being named among a group of companies assisting the European Central Bank in developing a digital euro. There is optimism that the ECB may also adopt Quant’s Overledger solution. Overledger is a blockchain-agnostic operating system that enables interoperability between blockchain networks and traditional systems.
Quant’s price may also benefit from the development of Fusion, a framework designed to secure assets, data, and logic across both public and permissioned distributed ledgers.
Fusion’s Devnet launched last week, with the testnet scheduled for release this month. The mainnet is expected “within months,” to be followed by the mainnet+.
Meanwhile, on-chain data shows that the supply of QNT tokens on exchanges has dropped to 1.64 million, its lowest level since May 25, a sign that investors are moving their tokens into self-custody wallets.
Quant price technical analysis
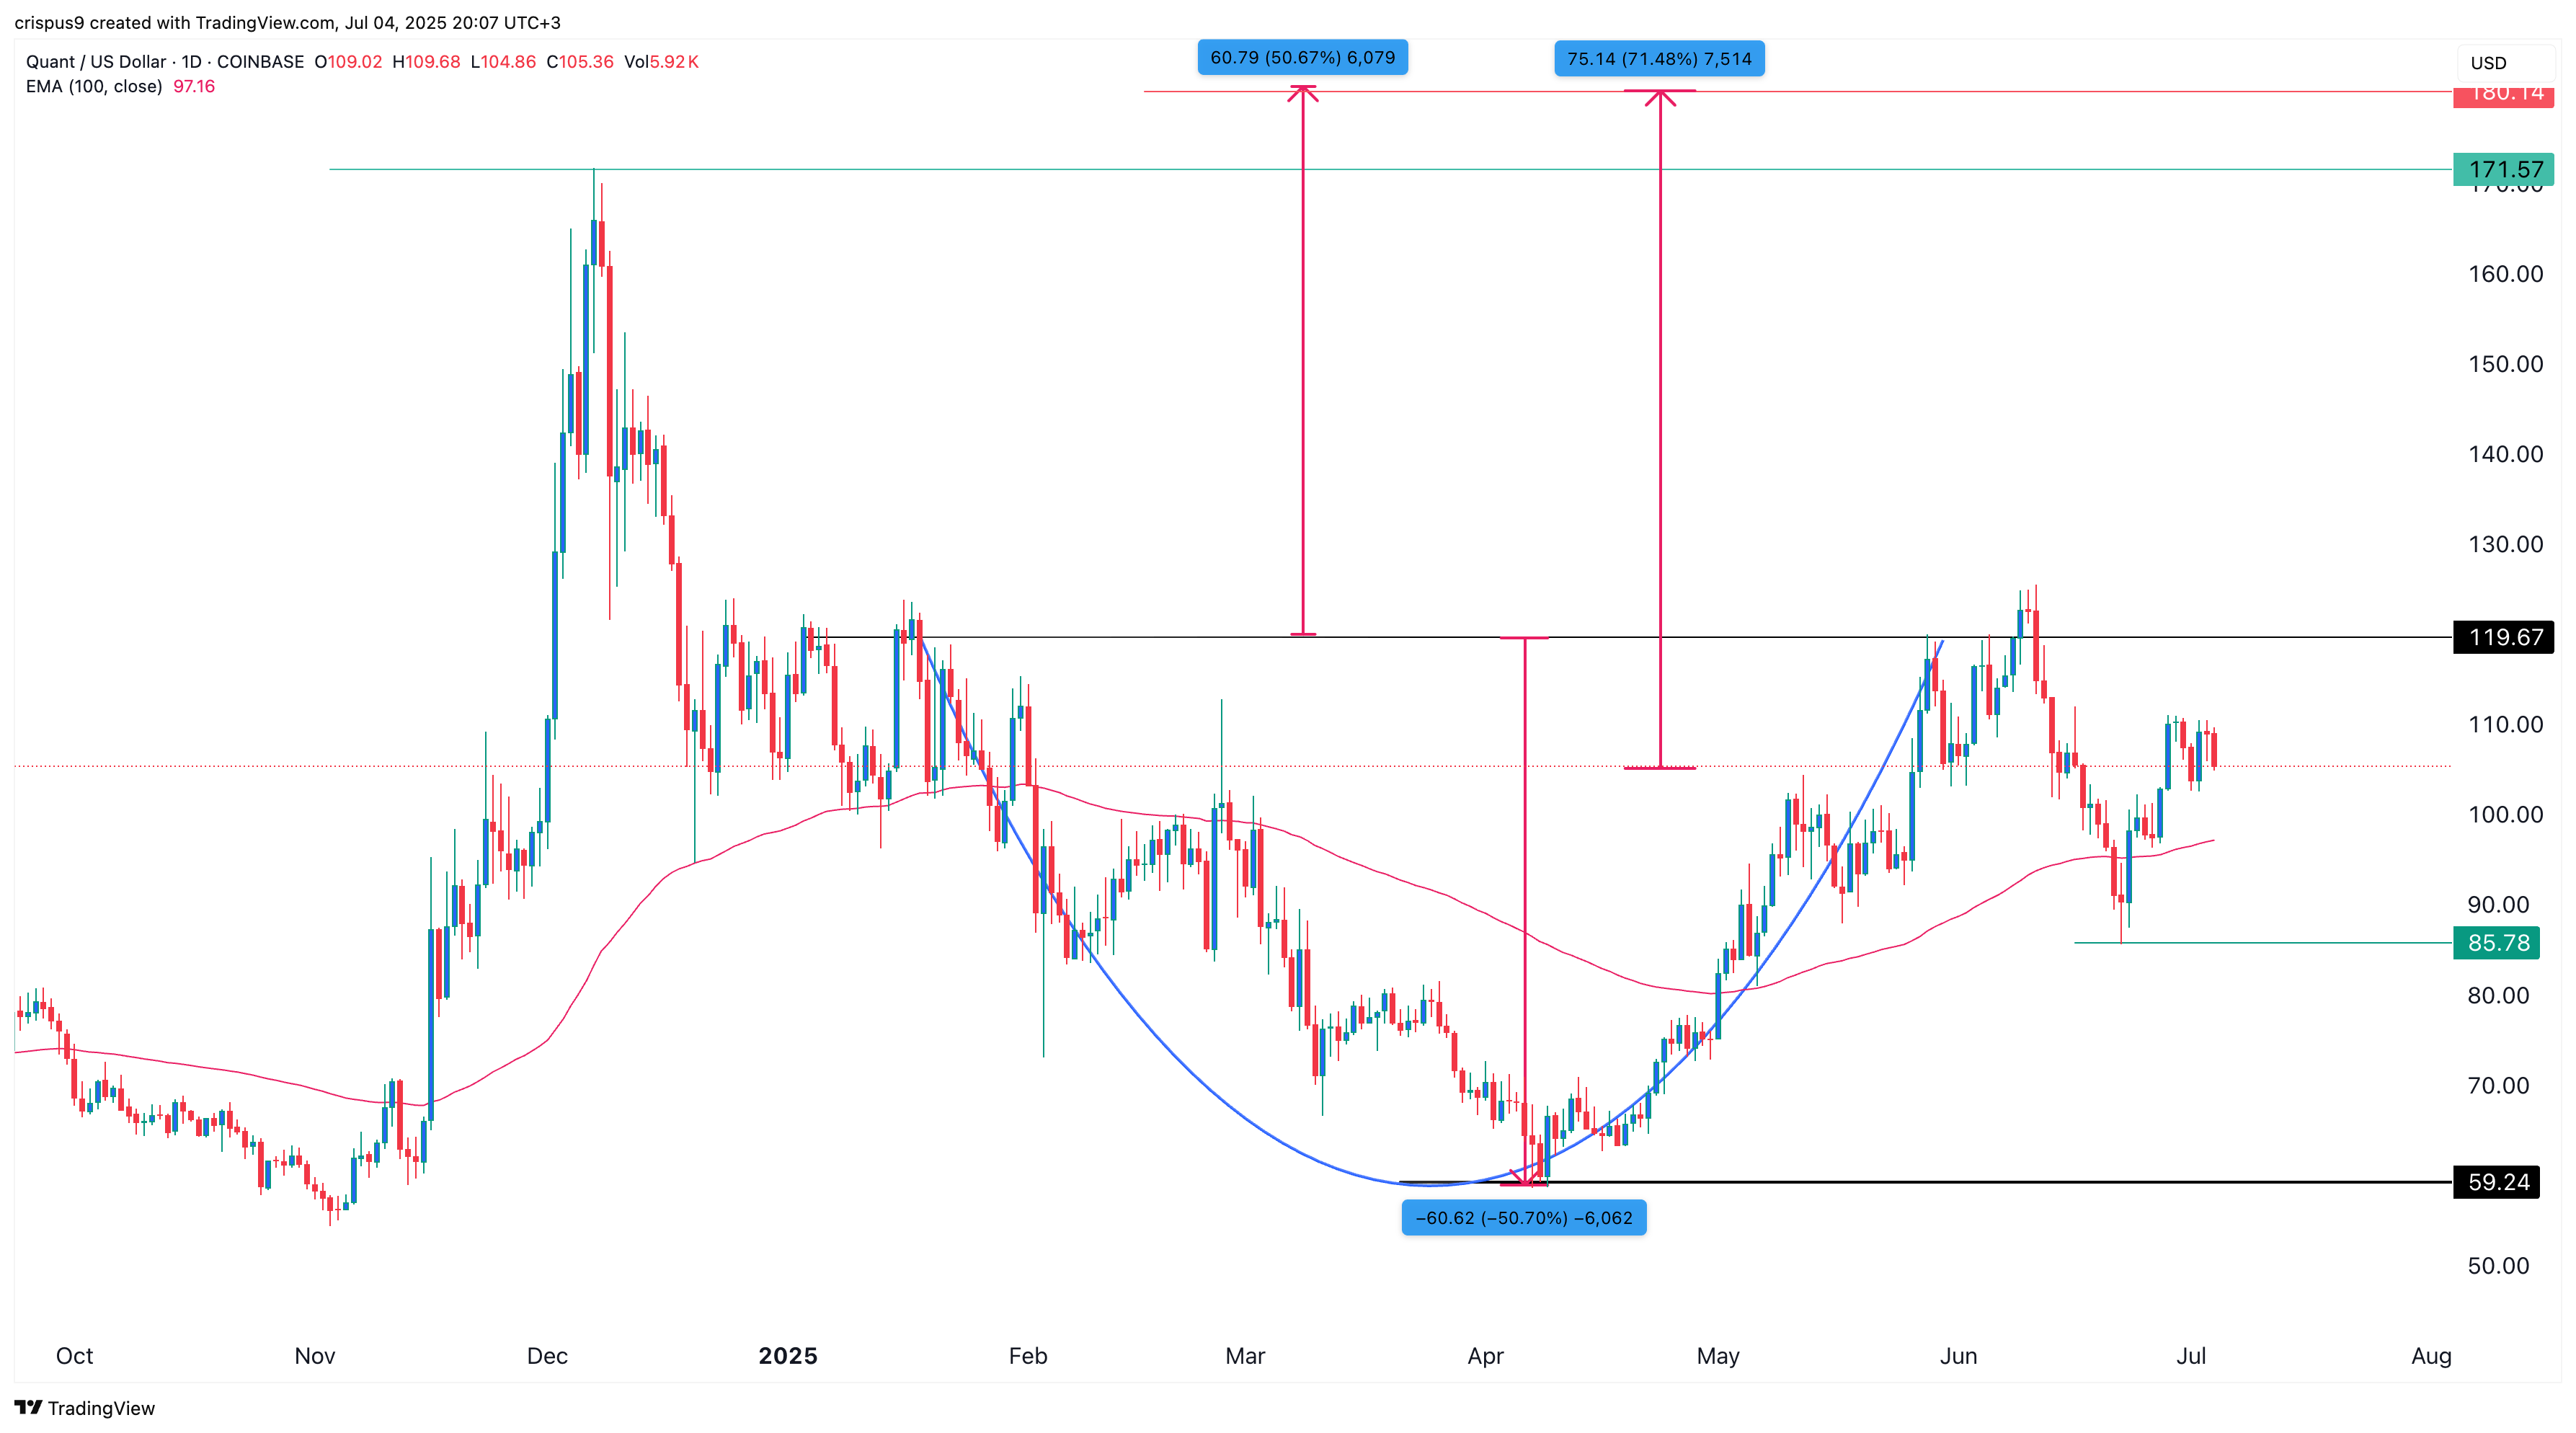
The daily chart indicates that QNT bottomed at $59.25 in April and rebounded to $120 in June. It has formed a cup-and-handle pattern, characterized by two distinct swings and a rounded bottom. The recent retreat represents the handle portion of this formation.
The distance between the cup’s upper and lower bounds is approximately 50%. Projecting this same distance from the upper boundary points to a potential rally toward $180, representing a 71% gain from the current level. However, this bullish forecast would be invalidated if the token drops below the support level at $85.78.