Bitcoin
Bitcoin (BTC)
$104,353.00 -0.05198
Bitcoin price
Ethereum
Ethereum (ETH)
$2,500.60 0.03211
Ethereum price
BNB
BNB (BNB)
$640.28 -0.00147
BNB price
Solana
Solana (SOL)
$143.99 -0.54751
Solana price
XRP
XRP (XRP)
$2.15 0.58065
XRP price
Shiba Inu
Shiba Inu (SHIB)
$0.0000115 -0.30225
Shiba Inu price
Pepe
Pepe (PEPE)
$0.0000103 2.48599
Pepe price
Bonk
Bonk (BONK)
$0.0000141 2.5326
Bonk price
dogwifhat
dogwifhat (WIF)
$0.781545 1.12809
dogwifhat price
Popcat
Popcat (POPCAT)
$0.29174 2.4975
Popcat price

RAY price at risk as Raydium users plunge 81%

Jayson Derrick
Edited by
Markets
RAY price at risk as Raydium users plunge 81%

Raydium’s token rose by over 12% on Thursday, June 19 as its active users and market share in the decentralized exchange industry retreated.

Raydium (RAY) price rose to an intraday high of $2.7040, up 40% from its lowest level this week. It then pared back those gains to trade at $2.30, giving it a market capitalization of $598 million.

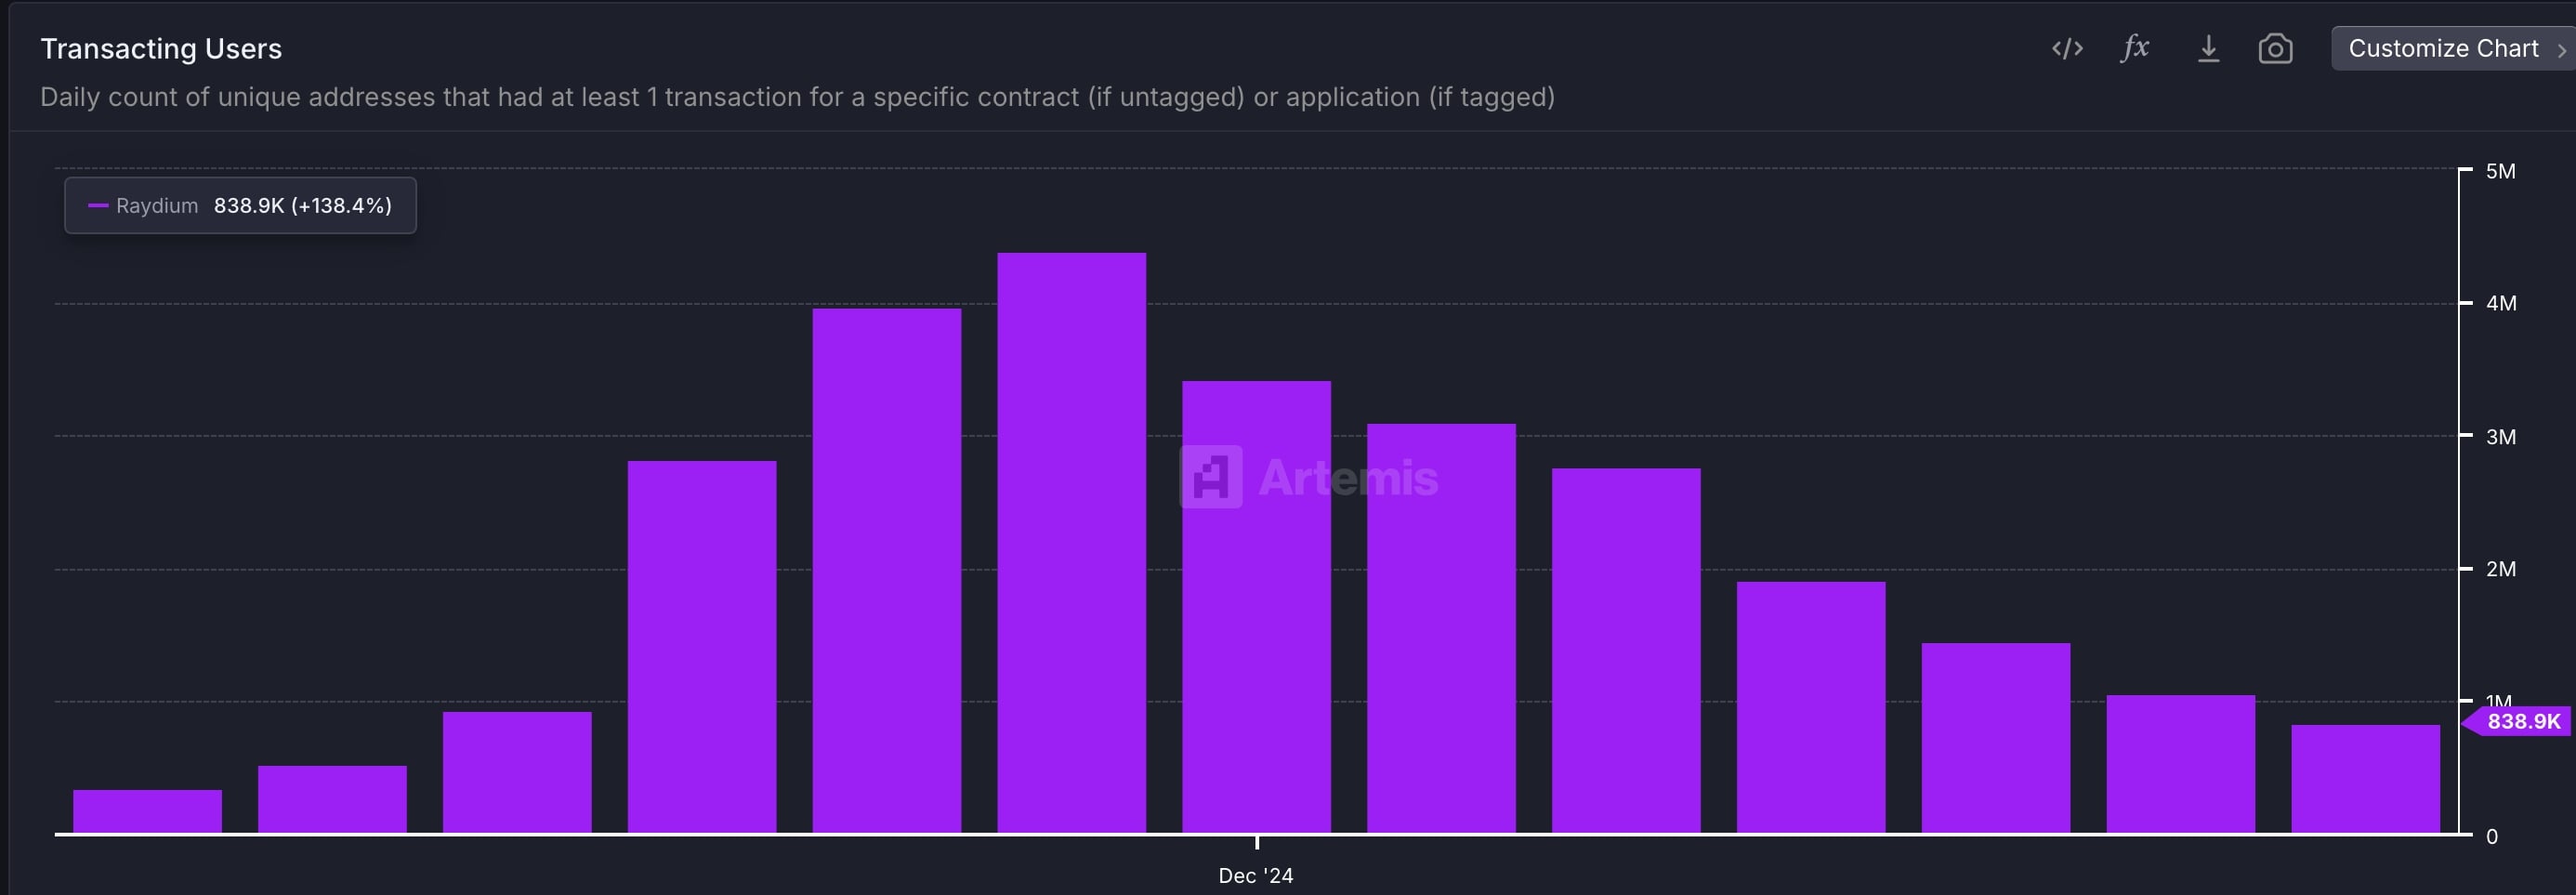
Third-party data shows that Raydium’s platform is under pressure. Data compiled by Artemis shows that Raydium has over 838,000 active transacting users, a figure that has dropped for six consecutive months. It is down 81% from its December level of over 4.4 million.

Raydium transacting users
Raydium transacting users | Source: Artemis

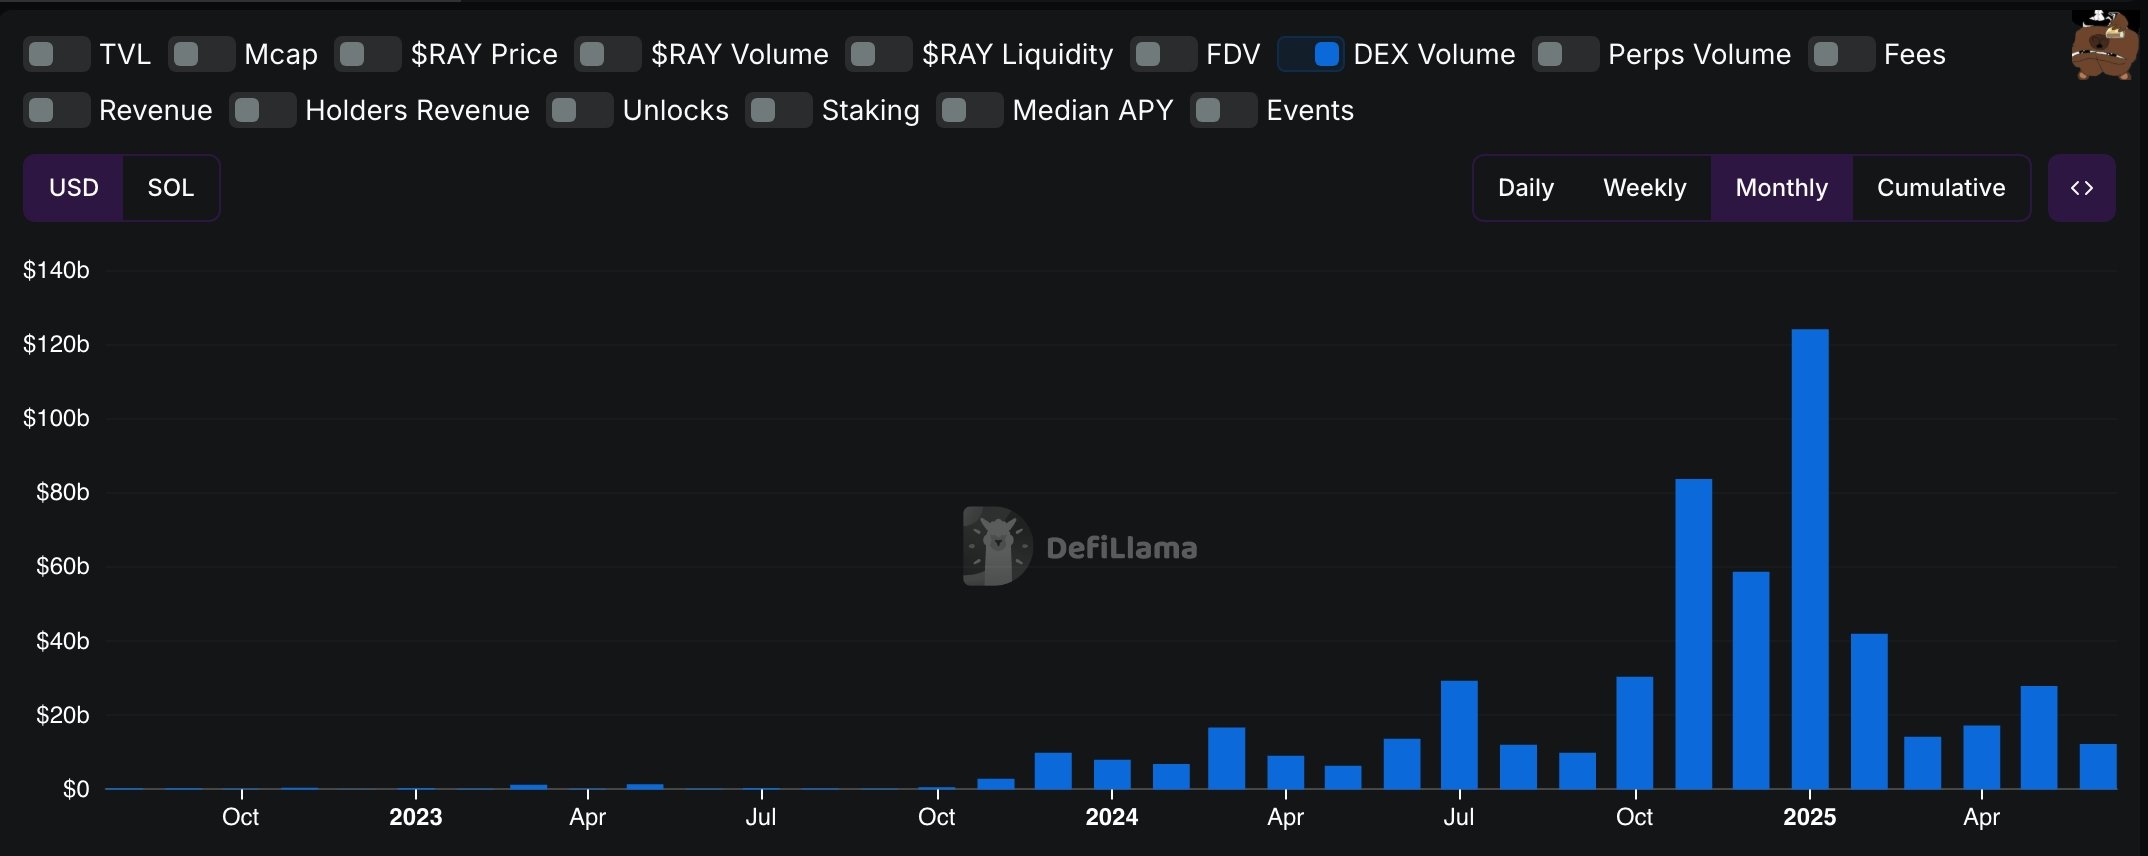
Additional data shows that Raydium has lost market share in the DEX industry. According to DeFi Llama, its network processed transactions worth over $21.9 billion in the past 30 days, far below PancakeSwap’s $138 billion and Uniswap’s $95 billion.

By comparison, the platform’s daily volume of $467 million trails other DEX networks such as PancakeSwap, Uniswap, Pump, and Aerodrome. Most notably, Raydium’s monthly transaction volume has dropped by 90%, falling from $124 billion in January to just $12 billion this month.

Raydium monthly DEX volume
Raydium monthly DEX volume | Source: DeFi Llama

The decline is closely tied to the underperformance of Solana (SOL) meme coins. CoinGecko data shows that many of these tokens have plunged more than 15% in the past seven days, pushing their total market cap down to $9.7 billion, a steep drop from $30 billion in January. Raydium typically sees higher volume when these tokens are rallying.

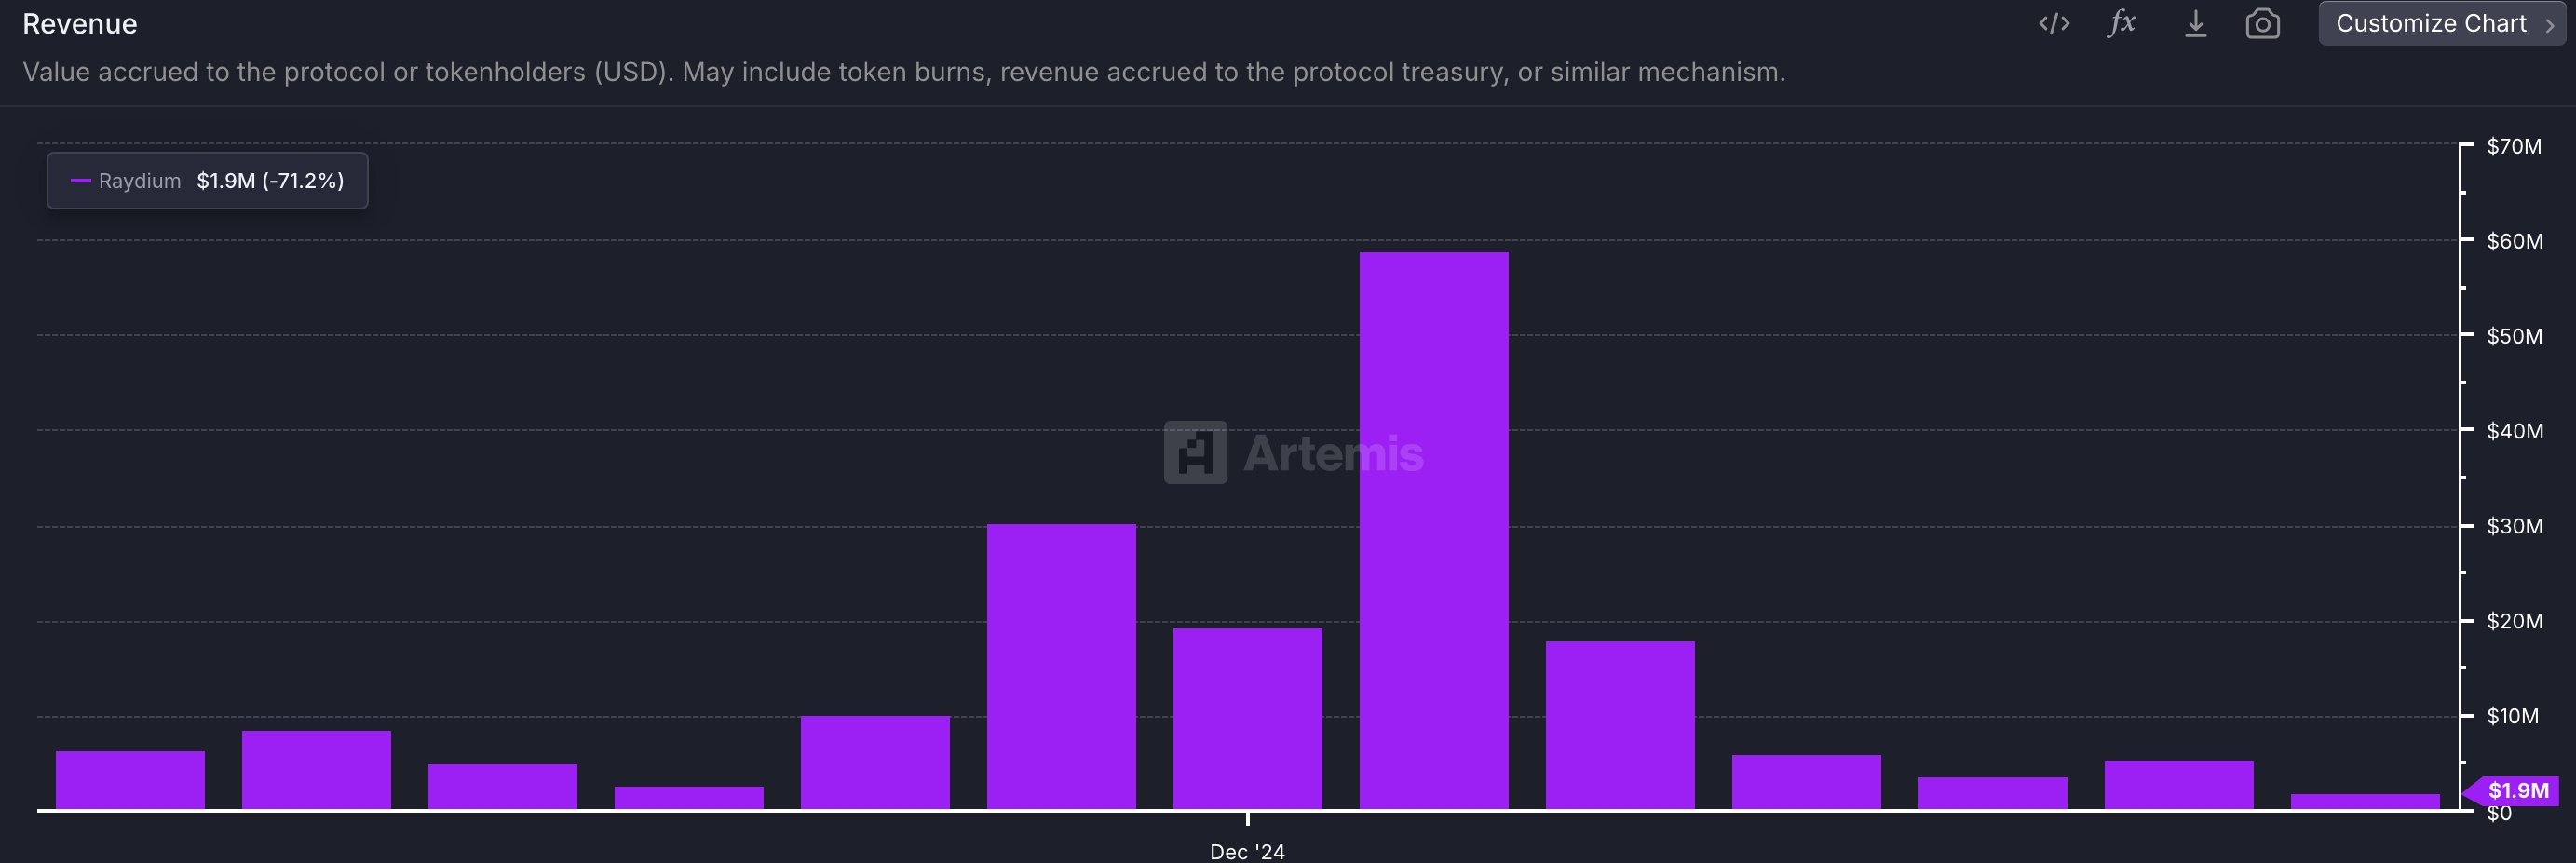
Lower transaction volume has also weighed heavily on Raydium’s revenue, which has plummeted from $58 million in January to $1.9 million this month.

Raydium monthly revenue
Raydium monthly revenue | Source: Artemis

RAY price technical analysis

RAY price
RAY price chart | Source: crypto.news

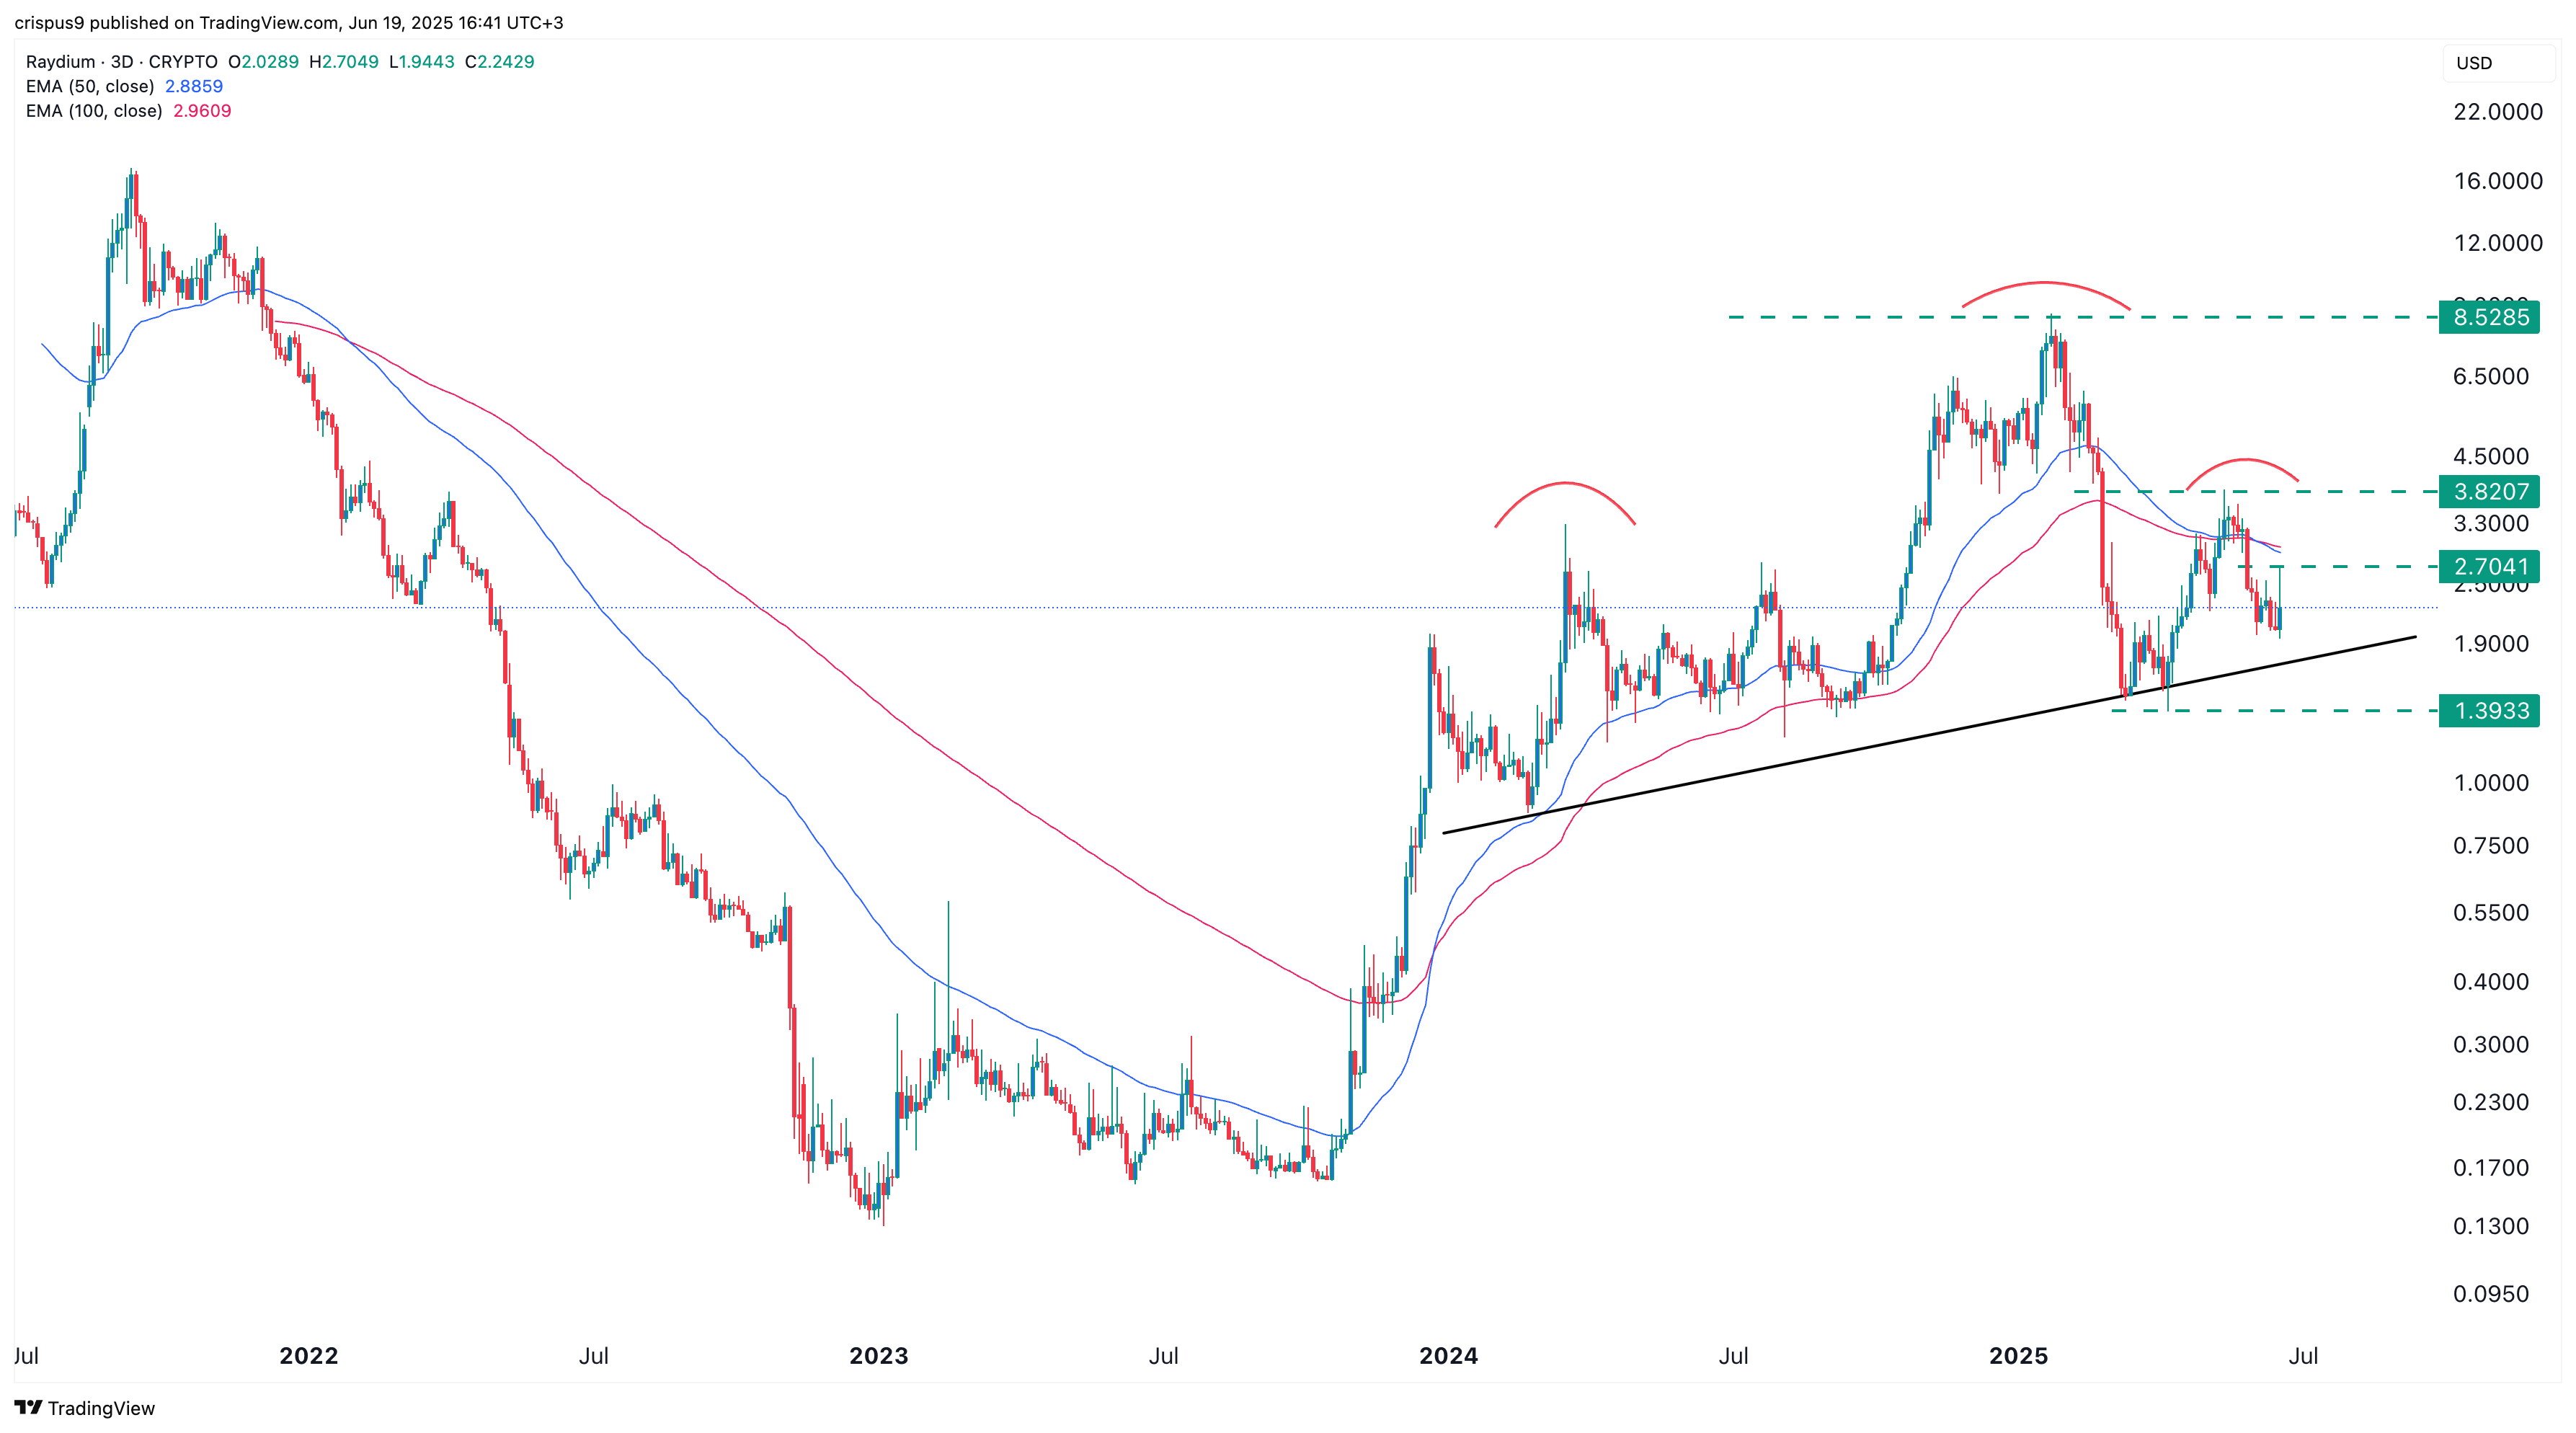
The three-day chart shows that Raydium’s price peaked at $8.5285 in January before pulling back to $2.25. It has since fallen below both the 50-day and 100-day Exponential Moving Averages, which have formed a bearish crossover.

A head-and-shoulders pattern has also emerged, a common bearish reversal signal. Based on this formation, the token could be headed for a breakdown toward $1.40, the April 10 low. However, a move above the right shoulder at $3.820 would invalidate this bearish setup.