Sellers Dominate ETH-USD Trading as Uncertainty Lingers

ETH-USD is currently down over 3 percent on the Kraken exchange, trading at $12.04536 at the time of writing. Even though a ‘hard-fork’ has been proposed to address the attack on The DAO, uncertainty over the outcome of this solution has plagued the market and seen sellers dominate. Exchanges will hold a lot of power once the hard fork comes into play and may choose to list both sides of the fork. Whichever coin trades higher will be supported and it remains to be seen what the exchanges will elect to do.
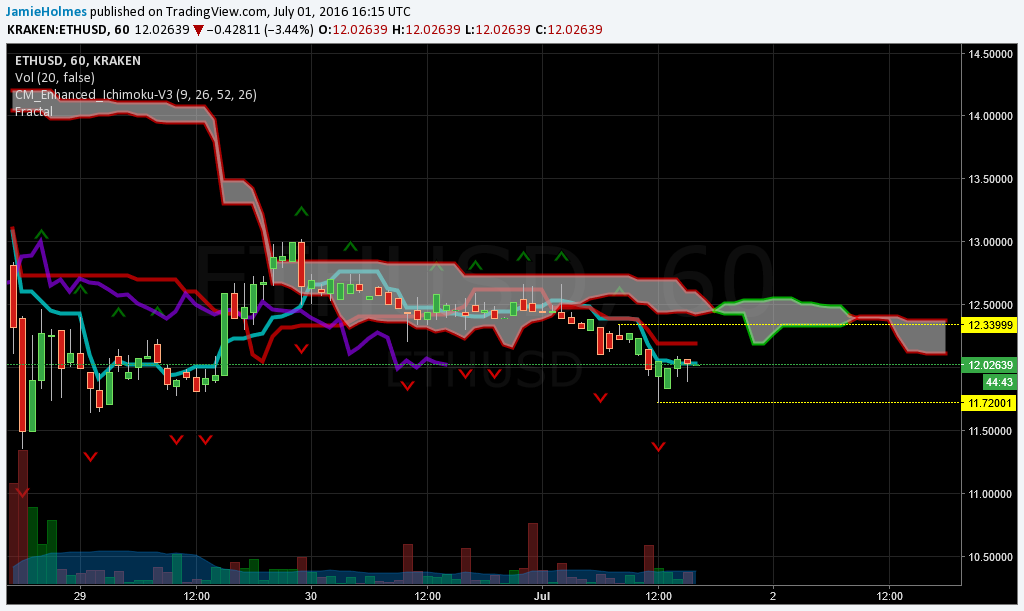
The chart below illustrates the short-term outlook with the hourly price action. The outlook is bearish as the price action is below the Ichimoku cloud at the moment. Also, notice that the color of the cloud is red, suggesting downward trending is more likely. Therefore, this could provide an optimal entry into a short position once ETH-USD bounces down from the cloud area, provided that it is tested. Looking over the previous trading sessions, we see that the cloud rejected the bullish advance, cutting it short at $13.00. However, this cloud was a lot thicker than the one for the trading sessions ahead, suggesting weaker resistance.
Alternatively, bears will push the price further down if the market breaks the most recent fractal buy level at $11.72001. An hourly close below this level will see bearish momentum intensify and see the market target fractal supports $11.00 and $10.31. The most recent fractal sell level is currently at $12.33999 and may provide an ideal shorting opportunity. On the other hand, if the market establishes a close above this level then this will invalidate the bearish outlook.
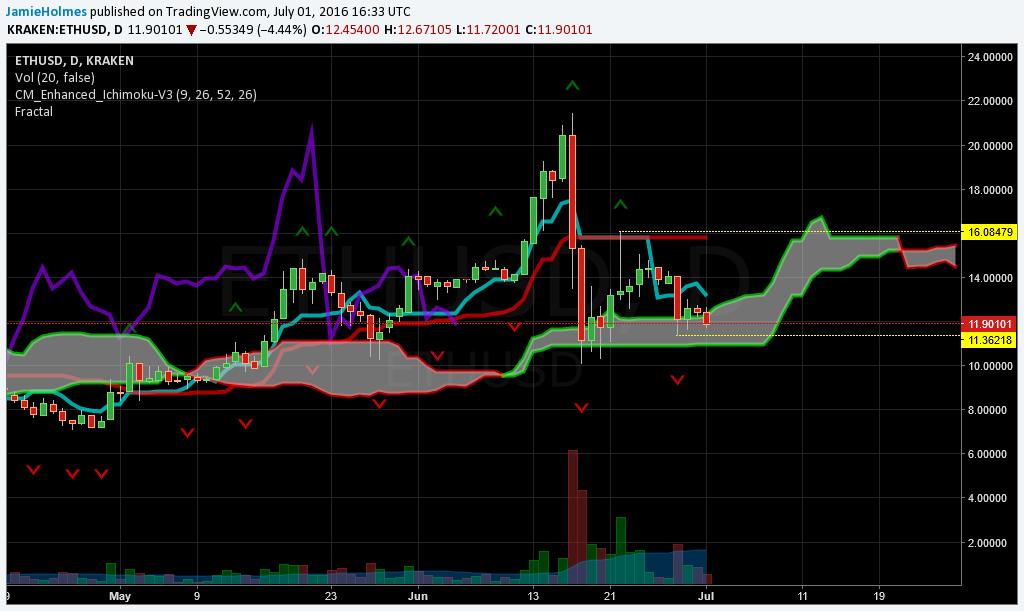
The longer-term outlook is shown below with the daily price action and shows how ETH-USD is currently encountering support provided by the Ichimoku cloud. Even at the height of the panic after The DAO hack, ETH-USD was not able to establish a close below the Ichimoku cloud. However, during this time, the base (dark-red) line and conversion (blue) line converged to the same price level, suggesting neutral momentum. This time, we see that the conversion line is trending downward and lower below the base line, signalling bearish momentum is in play at present. Therefore, there is a higher likelihood that the price action will be able to establish a close below the Ichimoku cloud and confirm the start of a long-term downtrend.
The chart shows the most recent fractal support lies at $11.36218 and a daily close below this level will most likely see the market start to trend lower below the Ichimoku cloud. Also, notice that the cloud has already started to turn from green to red, providing further confirmation. If the fractal support is broken then we should see the market tend toward fractal support at $10.10. On the other hand, if the cloud sustains as a support zone then the market will look to target the most recent fractal sel level at $16.08479.