Bitcoin
Bitcoin (BTC)
$91,832.00 -1.84409
Bitcoin price
Ethereum
Ethereum (ETH)
$3,212.65 -0.45305
Ethereum price
BNB
BNB (BNB)
$909.00 -0.275
BNB price
Solana
Solana (SOL)
$137.49 -0.36198
Solana price
XRP
XRP (XRP)
$2.25 -4.65573
XRP price
Shiba Inu
Shiba Inu (SHIB)
$0.000009 -3.37919
Shiba Inu price
Pepe
Pepe (PEPE)
$0.0000067 -2.89073
Pepe price
Bonk
Bonk (BONK)
$0.0000117 -2.99742
Bonk price
dogwifhat
dogwifhat (WIF)
$0.408044 -4.31563
dogwifhat price
Popcat
Popcat (POPCAT)
$0.104293 -2.64468
Popcat price

Shiba Inu Coin price forms extremely bullish pattern as key metric jumps

Anthony Patrick
Edited by
Markets
Shiba Inu Coin price forms extremely bullish pattern as key metric jumps - 1

Shiba Inu Coin price continued rising on Tuesday, reaching its highest point since Oct. 27 as the burn rate and derivatives market activity soared.

Summary
  • The Shiba Inu price rebounded and reached its highest level since October. 
  • It has formed a large falling wedge chart pattern on the daily chart.
  • The burn rate jumped by 278% on Tuesday.

Shiba Inu (SHIB) token was trading at $0.0000093, up by 35% from its lowest level this year. This surge has brought its valuation to over $5.5 billion. 

SHIB increased as key metrics continued to trend upward. Data compiled by Shibburn show that the token burn rate jumped by 278% in the last 24 hours to over 15.2 million. This token burn has increased the total token burn to over 410 trillion and the circulating supply to over 585 trillion tokens.

A token burn is a process in which cryptocurrencies are removed from circulation to improve tokenomics and reduce inflation.  

More metrics were highly bullish on Shiba Inu. For example, Nansen data indicate that the supply of Shiba Inu tokens on exchanges has continued to decline over the past few weeks and is now at its lowest level in months. A decline in exchange supply indicates that investors are not selling their tokens and are instead moving them to self-custody.

Meanwhile, the futures market has been highly encouraging, with the open interest soaring to the highest level since October 10. It reached a high of $145 million, substantially higher than the year-to-date low of $79 million. The volume of Shib tokens traded on centralized exchanges has soared. 

Shiba Inu Coin price technical analysis

shiba inu price
SHIB price chart | Source: crypto.news

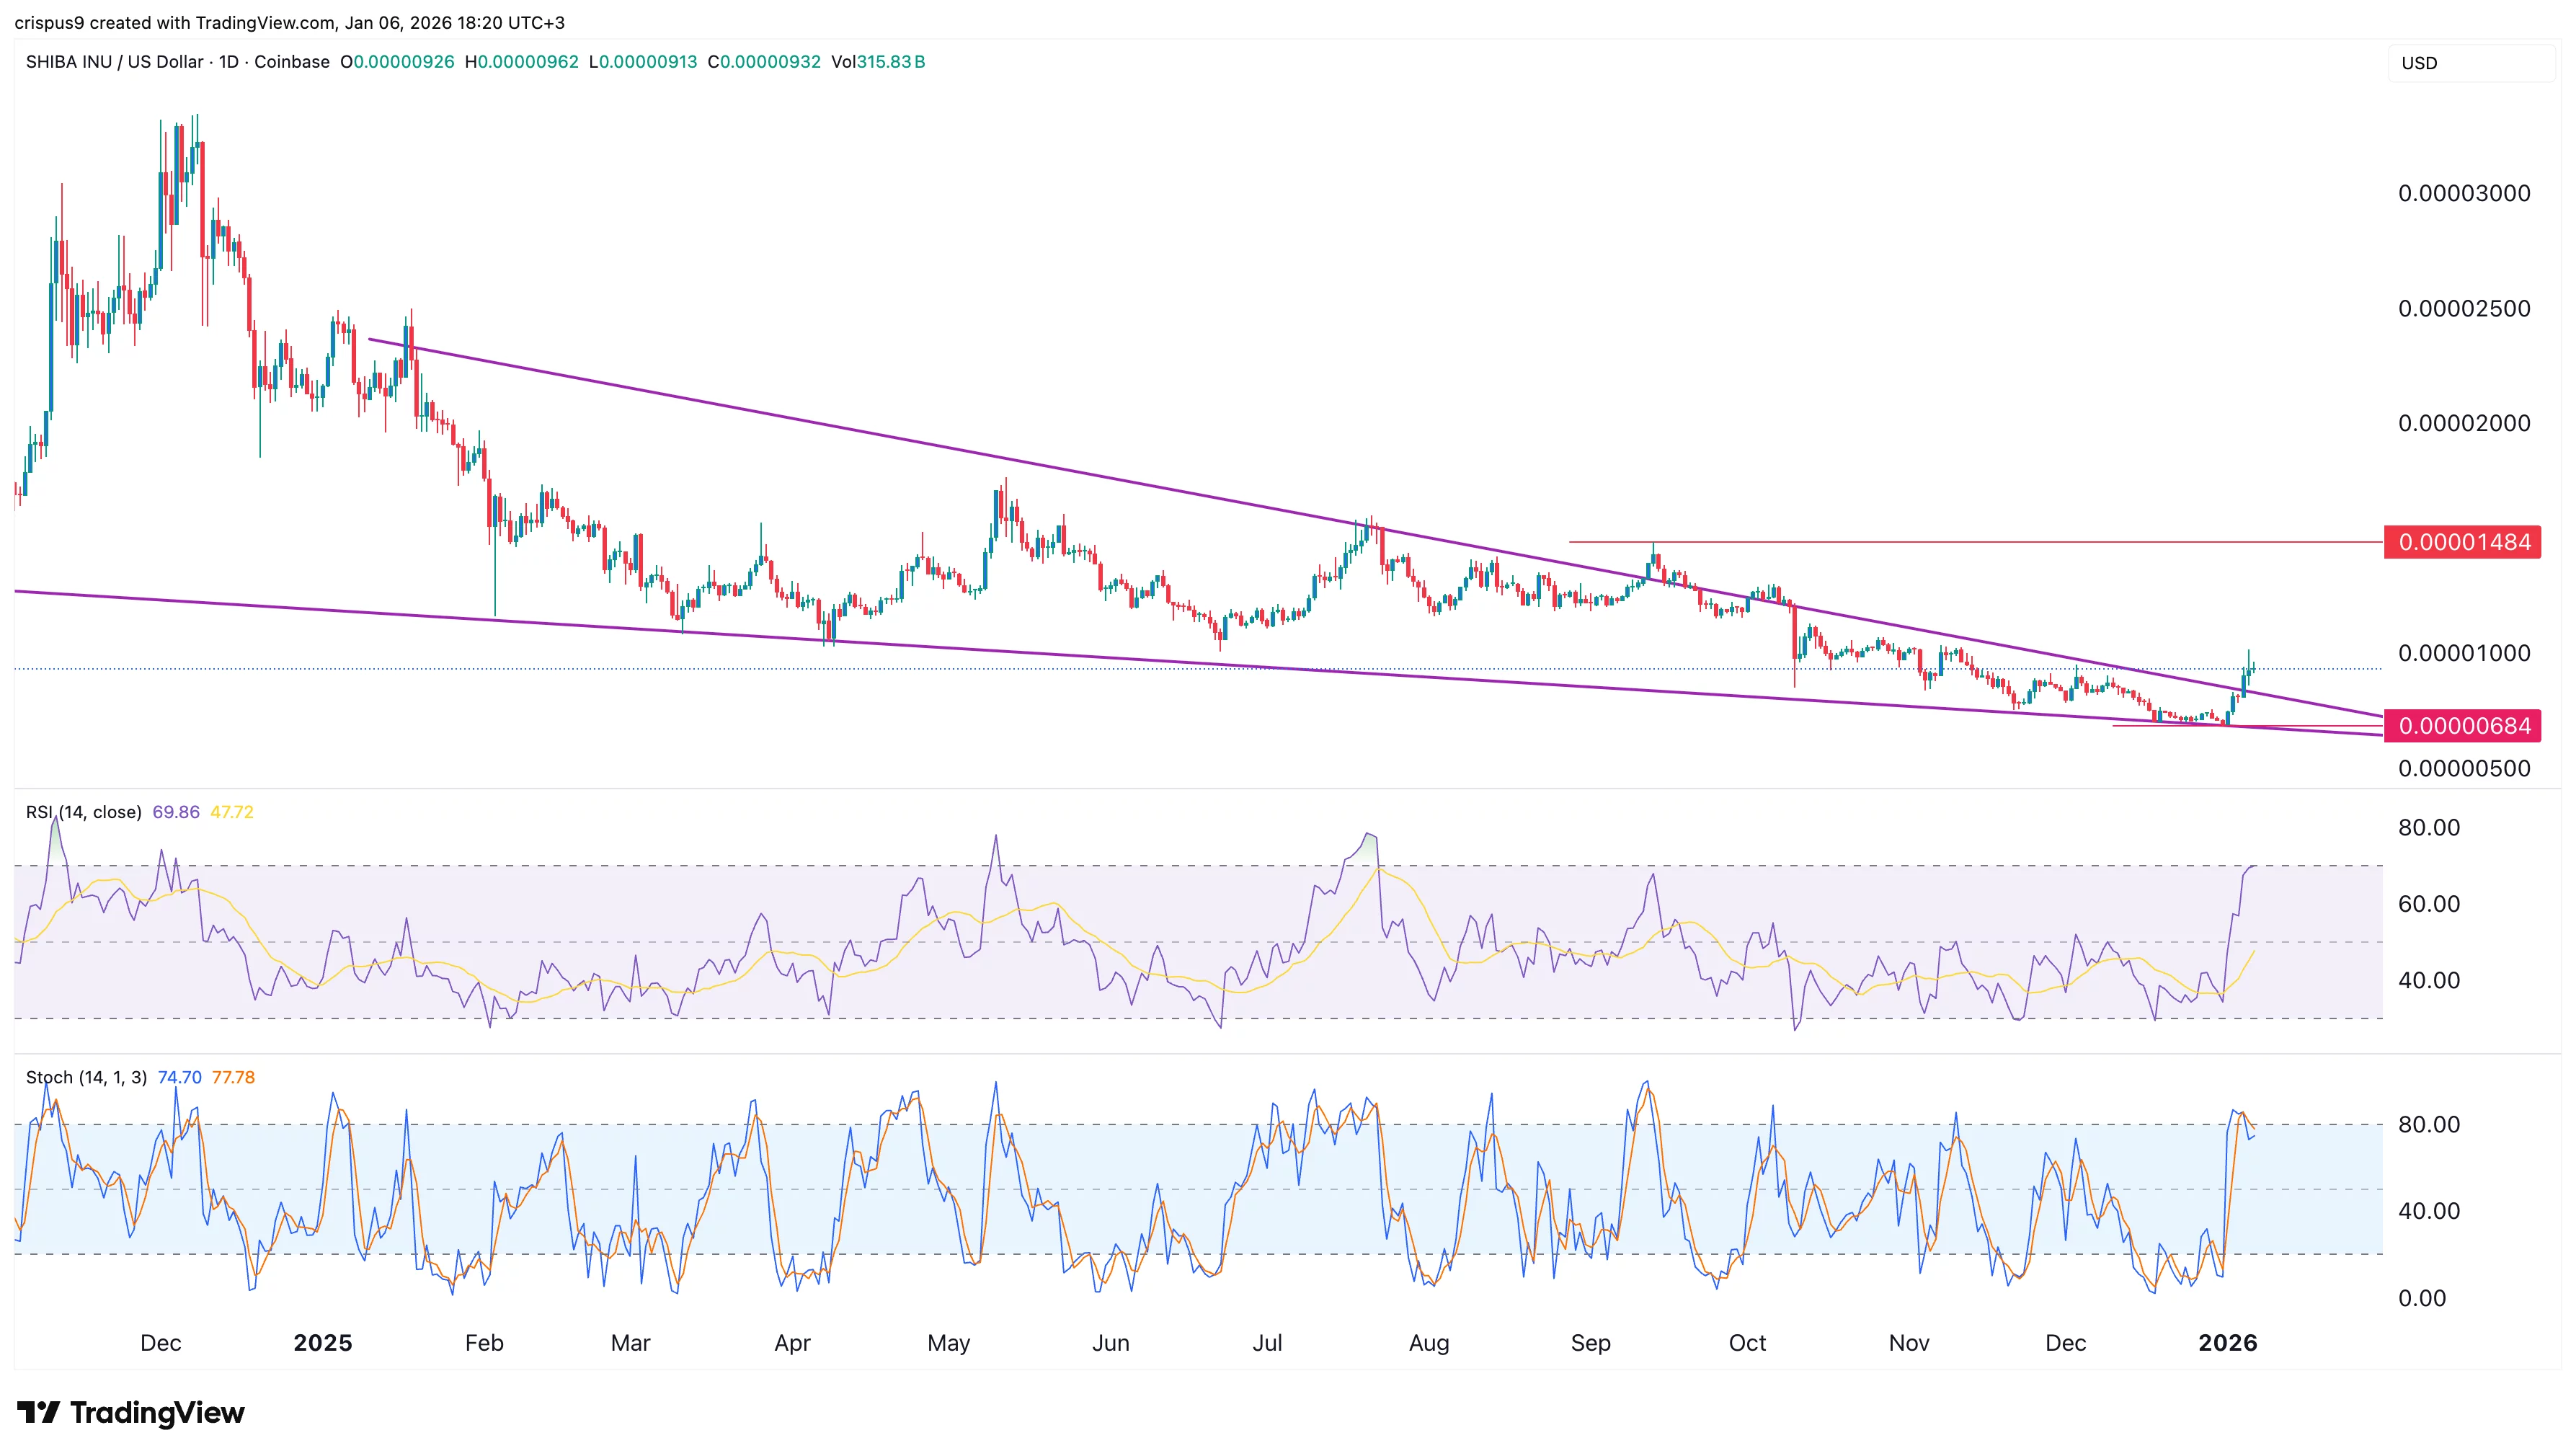
The daily chart shows that the Shiba Inu Coin price has rebounded from a low of $0.00000684 to a high of $0.000010. This rebound happened after the token formed a giant falling wedge chart pattern, a common bullish reversal sign. This pattern consists of two descending, converging trendlines. 

The Relative Strength Index and the Stochastic Oscillator have continued to rise, indicating increasing momentum. Therefore, the most likely Shiba Inu price forecast is bullish, with the next key target being at $0.000014, its highest point in September.