Bitcoin
Bitcoin (BTC)
$93,934.00 -0.38849
Bitcoin price
Ethereum
Ethereum (ETH)
$3,239.94 -0.22011
Ethereum price
BNB
BNB (BNB)
$692.04 -0.40617
BNB price
Solana
Solana (SOL)
$185.92 0.32853
Solana price
XRP
XRP (XRP)
$2.49 5.77498
XRP price
Shiba Inu
Shiba Inu (SHIB)
$0.0000216 -1.92536
Shiba Inu price
Pepe
Pepe (PEPE)
$0.0000176 -1.46435
Pepe price
Bonk
Bonk (BONK)
$0.0000276 -0.85404
Bonk price
dogwifhat
dogwifhat (WIF)
$1.53 -2.54309
dogwifhat price
Popcat
Popcat (POPCAT)
$0.550625 4.69433
Popcat price

Shiba Inu hits key price as SHIB token burn trend slows

shiba-inu-hits-key-price-as-shib-token-burn-trend-slows
Edited by
Markets
Shiba Inu hits key price as SHIB token burn trend slows

Shiba Inu’s price continued its recovery this week as Bitcoin and most altcoins bounced back and the crypto fear and greed index stabilized.

The SHIB token has risen for four consecutive days, reaching a high of $0.0000020, its highest point since June 17.

Shiba Inu token burn momentum slows

Shiba Inu’s rally coincided with Bitcoin jumping to a high of $65,000 for the first time since June 19 and the crypto fear and greed index approaching the greed zone of 60.

Other meme coins have done well this week. As was reported earlier, tokens like Pepe, Floki, Dogwifhat, and Brett were up by over 20% in the past hours. 

Notably, Shiba Inu’s daily trading volume of $650 million was smaller than Pepe’s $2.9 billion. It was also lower than Dogwifhat’s $978 million and Floki’s $978 million. This indicates that Shiba Inu, along with Dogecoin, is losing momentum among traders.

On-chain data shows that the volume of Shiba Inu token burn has dropped in the past few weeks. The biggest burn this month happened on the 11th when users burned over 72 million tokens. Since then, it has averaged less than 200,000 a day.
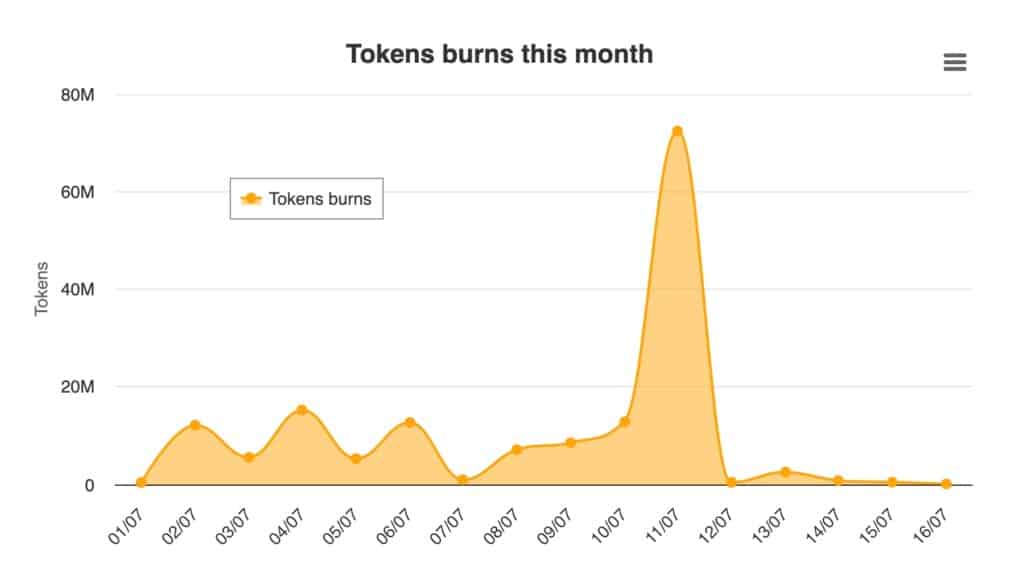
Shiba Inu burn

Shiba Inu monthly burn

Crypto traders are now focusing on Shiba Inu’s chart for clues on whether the ongoing recovery will continue. 

Shiba Inu price crossed a key resistance
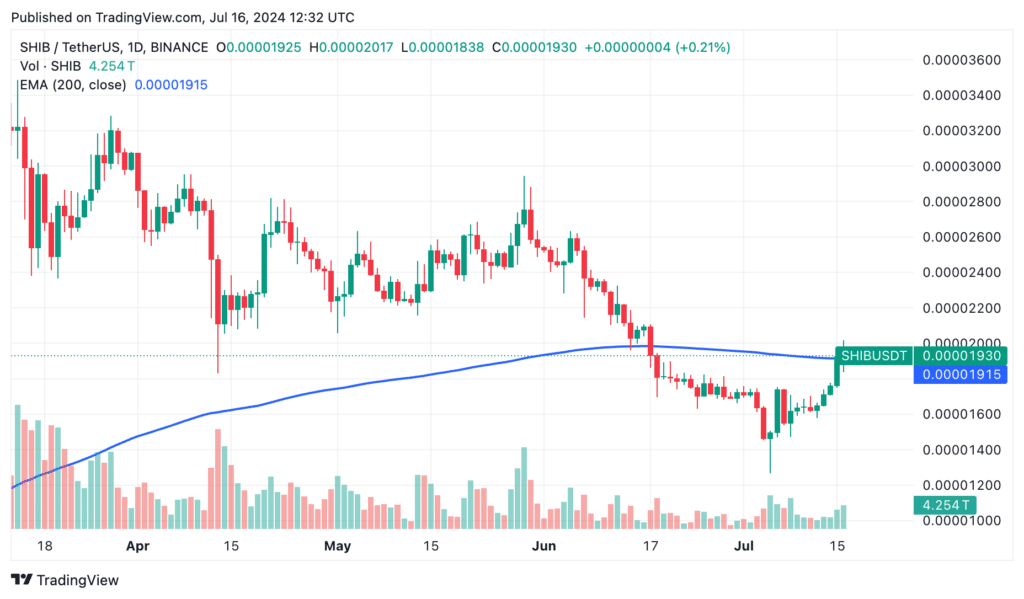
Shiba Inu price

SHIB price chart

On the daily chart, the ongoing rebound occurred after the token formed a hammer pattern on July 5. This pattern is one of the most popular bullish reversal signs in the market.

Shiba Inu has now crossed the important resistance point at $0.000018, its lowest swing on April 13, signaling that it is gaining momentum.

Most importantly, the token has now found substantial resistance at the 200-day Exponential Moving Average (EMA). 

Therefore, more upside will be confirmed if the token breaks above this EMA and closes above its intraday high of $0.000020. If it fails to do that, it will form a doji or a shooting star candlestick pattern and resume its downtrend.