Solana price eyes $425 as monthly chart flashes bullish pattern


Solana price may be gearing up for a major rally, as a bullish cup-and-handle pattern taking shape on the monthly chart points to a potential $425 target.
- Solana price has recently broken its higher-low structure on the daily chart, but continues to hold its long-term ascending channel.
- A cup-and-handle formation on the monthly chart points to a potential breakout toward the $425 Fibonacci extension target.
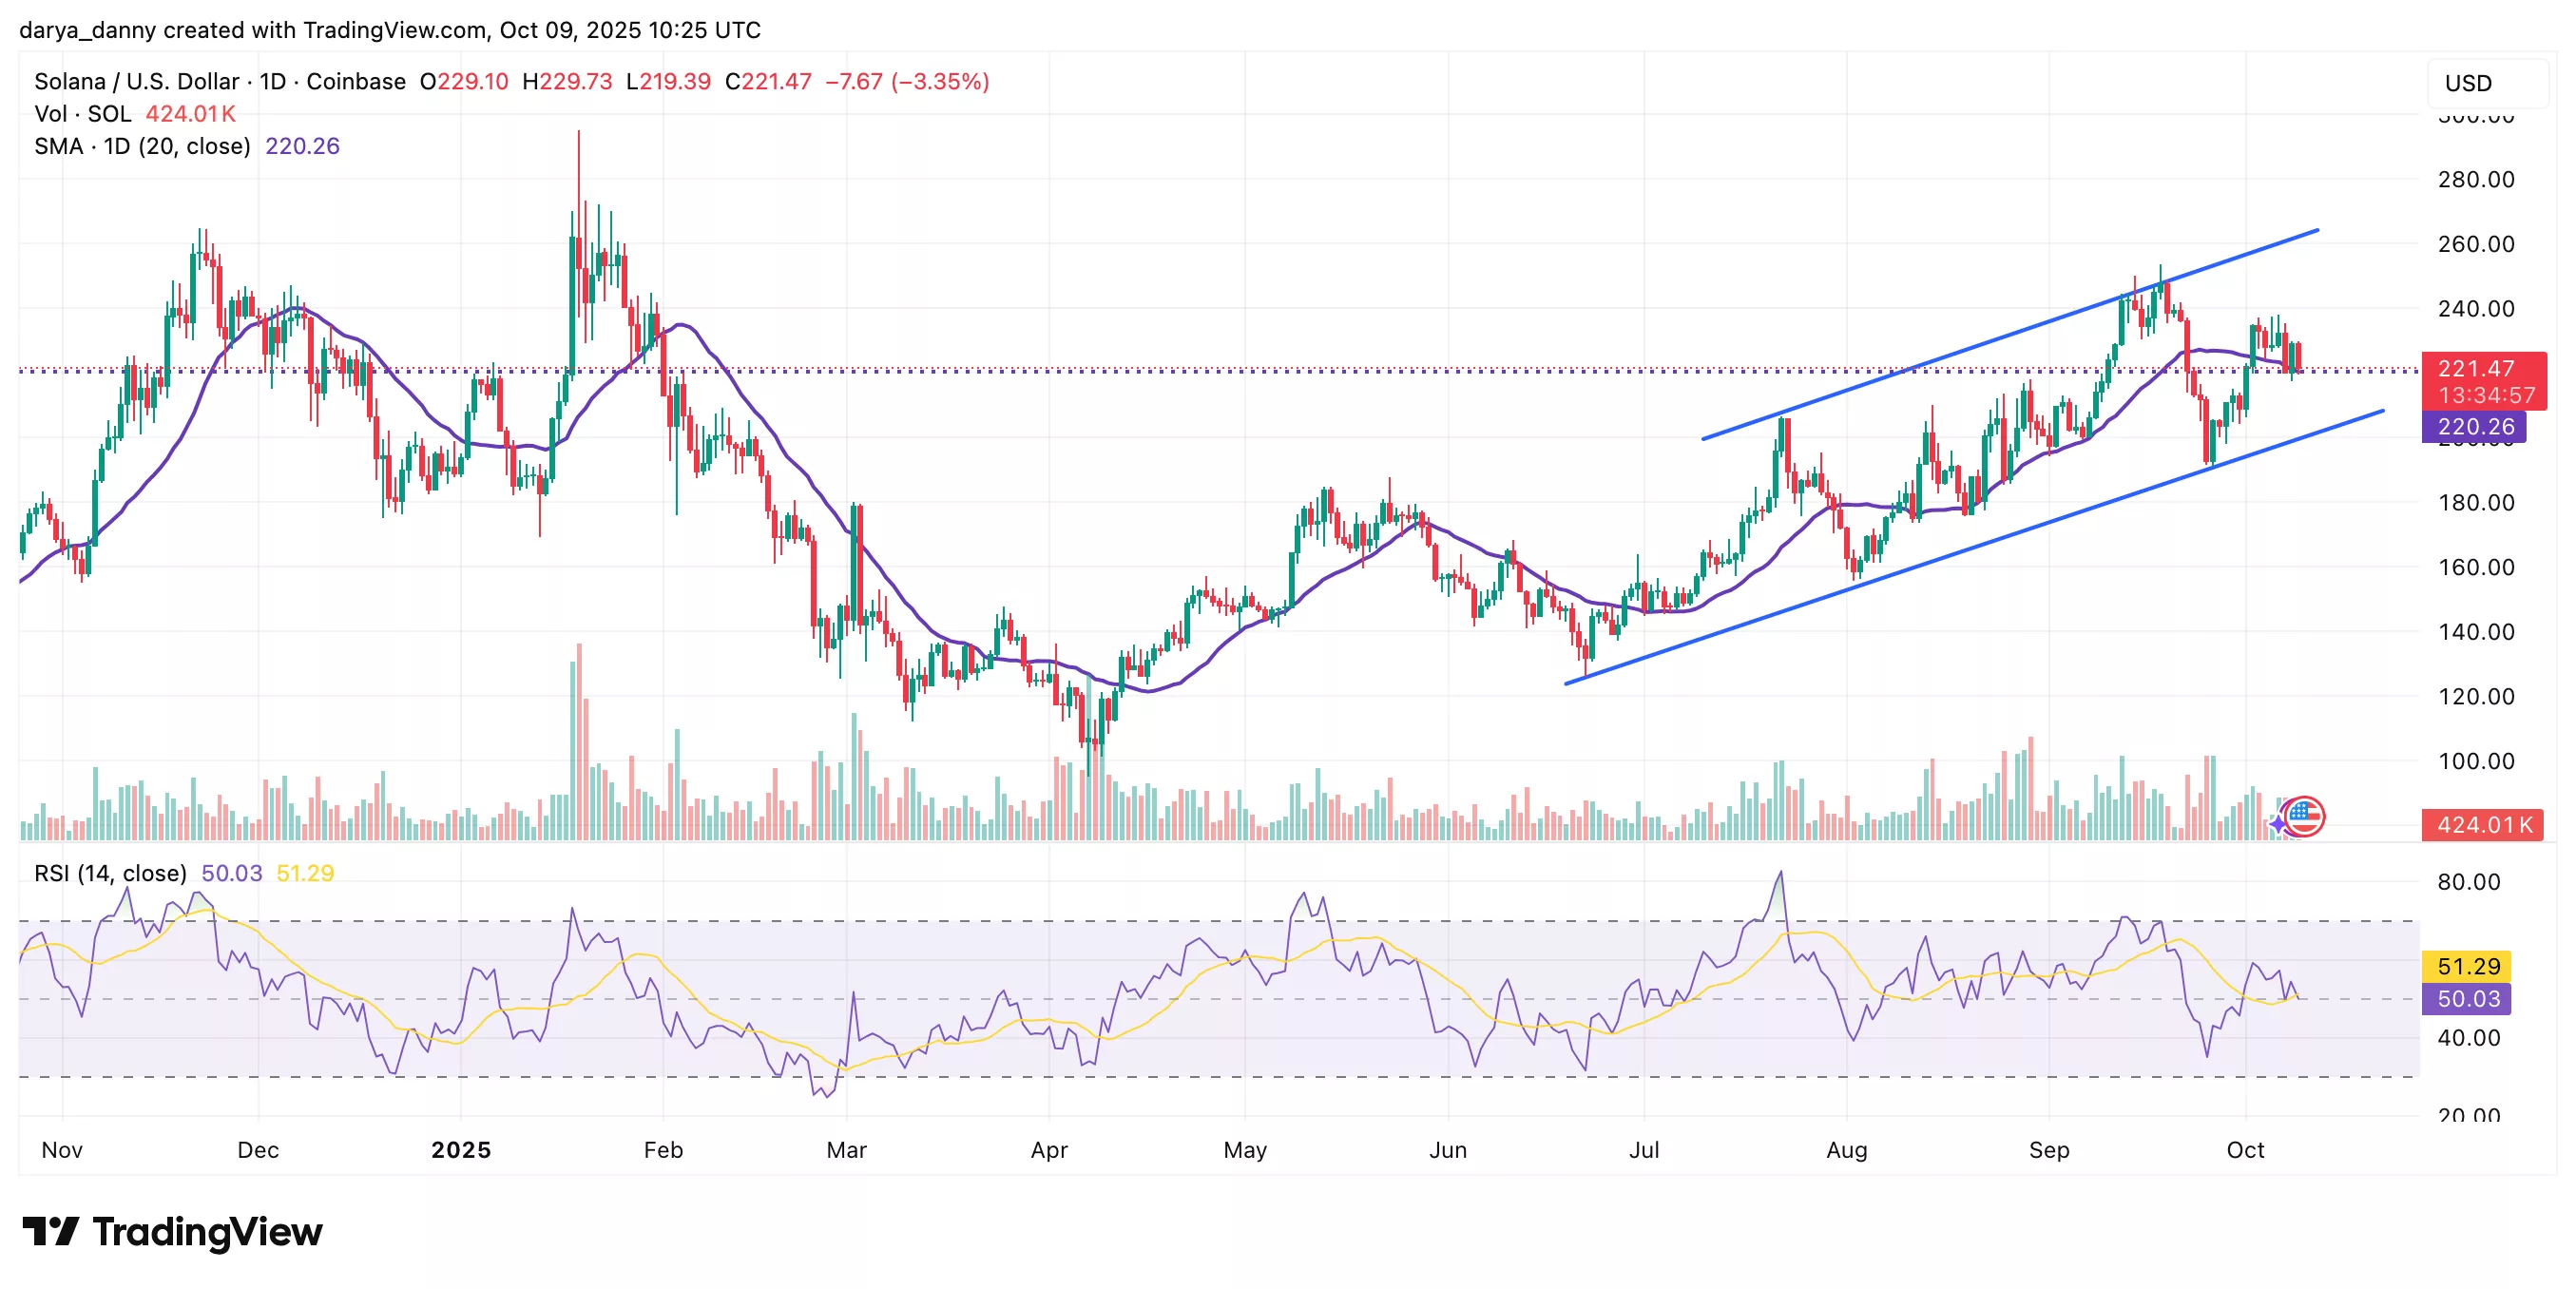
Solana (SOL) price has recently broke its pattern of higher lows that had held since early August, tumbling nearly 25% from the recent high of $253 to a low of $190, where buyers stepped in to scoop up the dip.
While the bounce off this level showed strength, the recovery rally failed to reclaim the previous high, with the token printing a lower high near $237, signalling of waning short-term bullish momentum.
However, medium-term sentiment remains constructive, with Solana price trading above the 20-day SMA (around $220) and holding near $222 at press time. Additionally, the price continues to respect the ascending channel on the daily chart.
Solana price eyes $425 target
While the near-term target remains around $253, there is potential for a much larger breakout if macro conditions align.
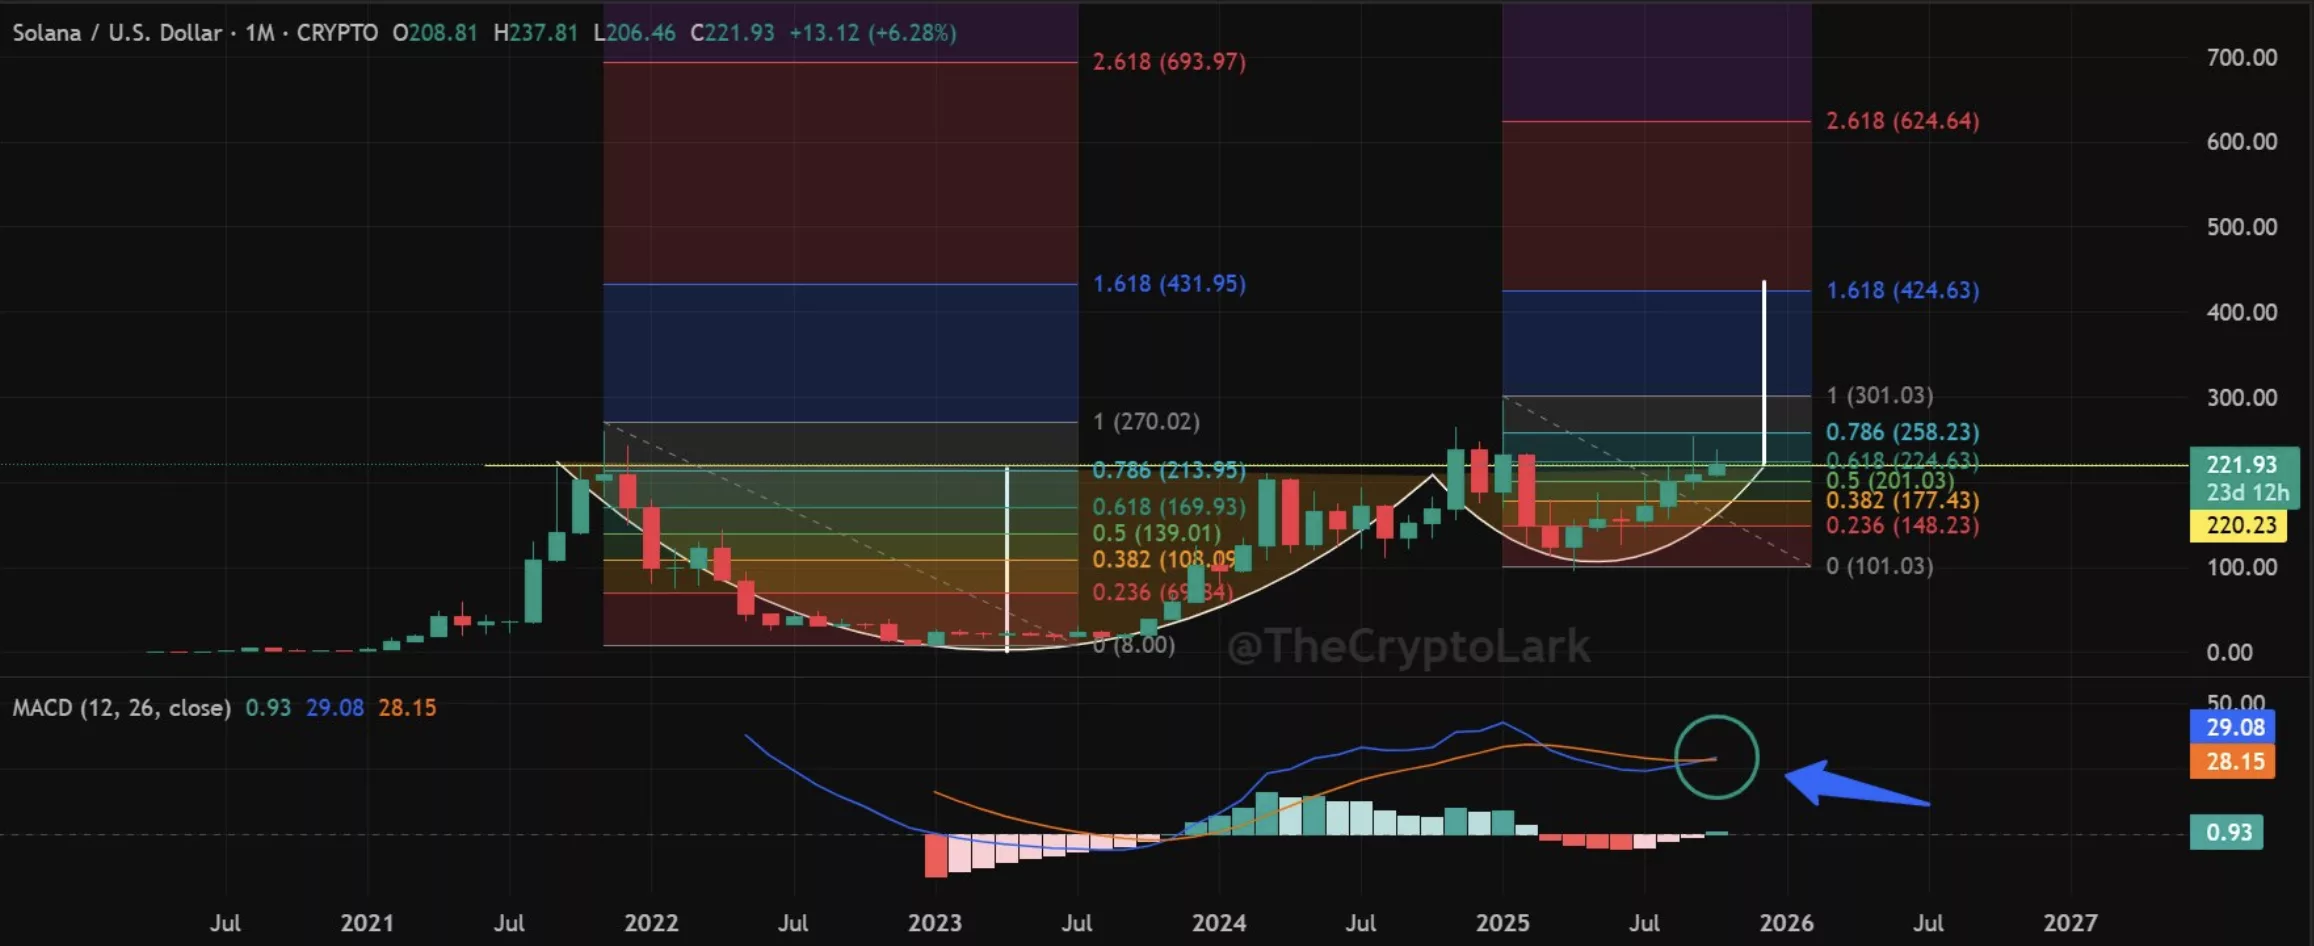
On the monthly timeframe, Solana price action appears to be forming a textbook cup-and-handle pattern — a bullish setup that, if confirmed, could mark the beginning of a new macro uptrend for SOL. The pattern’s breakout aligns closely with the 1.618 Fibonacci extension level, which sits around $425.
Additionally, the monthly MACD has just flashed a golden cross, with the MACD line crossing above the signal line, indicating a potential shift in long-term momentum from bearish to bullish and reinforcing the case for a run towards the $425 target.