Solana price flashes a multi-year bearish pattern despite soaring network metrics

Solana price continued its strong downward trend and hit its lowest level since January 2024 as the crypto market crash intensified despite its strong fundamentals.
- Solana price crashed to the lowest level in years.
- Third-party data shows that it has solid fundamentals.
- It has formed a giant multi-year head and shoulders pattern on the weekly chart.
Solana (SOL) dropped to $104, down sharply from its all-time high of nearly $300. This crash has erased billions of dollars in value.
The drop is notable as it is happening at a time when Solana’s fundamentals are improving. For example, data compiled by Nansen shows that its network is the most popular among investors.
Solana handled over 2.34 billion transactions in the last 30 days, a 33% increase. Its transaction count was much higher than other networks like Ethereum, Base, and BNB Chain, combined
Solana’s active addresses jumped by 67% in January to over 98 million. This growth means that it will cross the 100 million milestone, which is higher than other chains combined. Its stablecoin inflow has also jumped.
Solana is also generating substantial sums of money in fees. It made over $26 million in the last 30 days, much higher than the $14 million that Ethereum made. BNB Chain made $19 million in the same period.
Most importantly, Solana ETFs are seeing more demand from American investors this year. Spot SOL ETFs added $104 million in inflows in January as Bitcoin, Ethereum, and Solana shed assets.
Therefore, the Solana price crash is mostly because of the ongoing performance of the broader sector. Bitcoin and most altcoins have all plunged in the past few days, with the trend accelerating during the weekend.
Market participants are still reflecting on the nomination of Kevin Warsh to become the next Federal Reserve Chair and the rising geopolitical tensions between the United States and Iran.
Solana price technical analysis
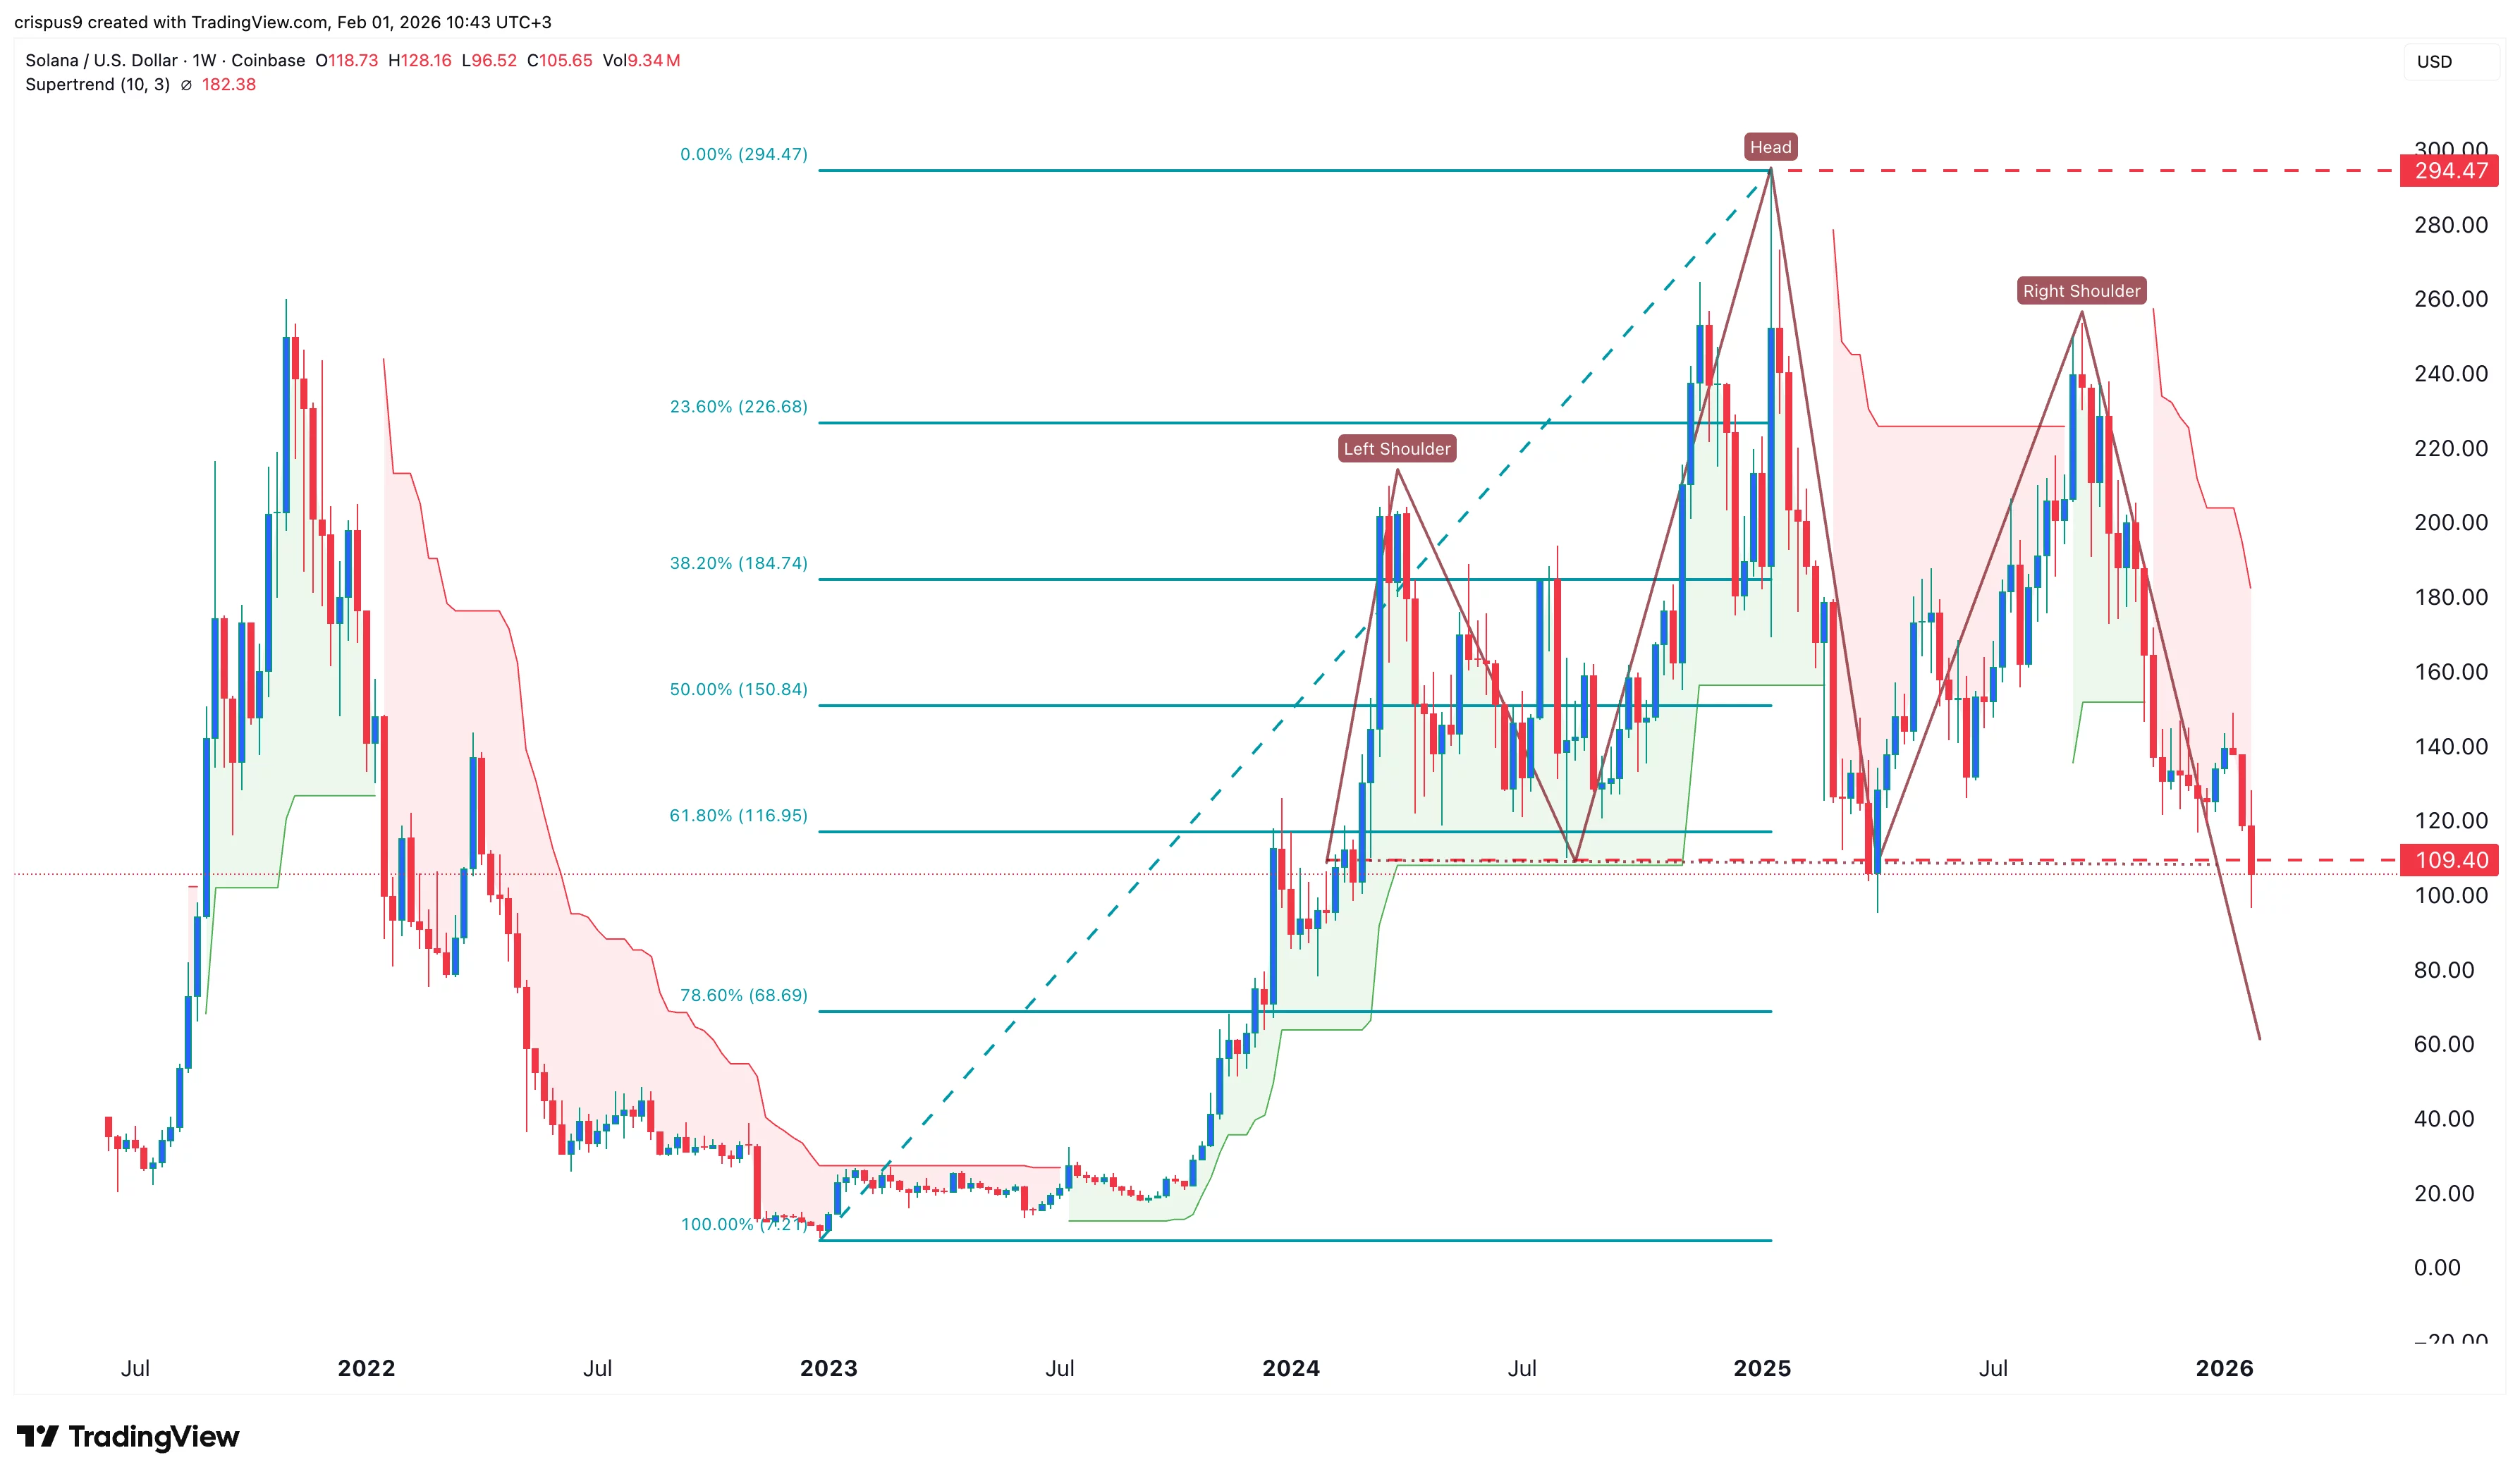
The weekly timeframe chart shows that the Solana price has crashed in the past few months. A closer look shows that it is in the process of forming the highly bearish head-and-shoulders pattern, whose neckline is at $109. It has now moved below the neckline, confirming the bearish outlook.
Solana price has moved below the 50-day and 100-day Exponential Moving Averages and the Supertrend indicator. It has also dropped below the 61.8% Fibonacci Retracement level, confirming the bearish outlook.
Therefore, the most likely scenario is where it continues falling as sellers target the next key target at $70, which is the 78.6% Fibonacci Retracement level.